


Estos informes reportan la situación epidemiológica del COVID-19 en Puerto Rico por Semana Epidemiológica. Estos reportes detallan el nivel de transmisión comunitaria, tasa de incidencia, la tasa de positividad molecular, desglose de casos confirmados y probables por grupos de edad, sexo, municipios y regiones de salud, así como métricas sobre reinfecciones, brotes activos, uso de unidades de cuidado intensivo, defunciones, prevalencia de síntomas reportados y secuenciación de variantes de Ómicron.

Using the methodology of Council for Community and Economic Research (hereinafter, C2ER), a non-profit professional organization dedicated to research on community and economic development, the Institute of Statistics is responsible for collecting the prices of goods and services within the categories of supermarket, housing, transportation, public services and miscellaneous items. The data is sent to C2ER, who calculate the average prices and indices for each of the categories, allowing the comparison of costs with the equivalent cost in the United States. Finally, the Cost of Living Index (COLI) is calculated, which the C2ER has been preparing since 1968 for more than 300 urban areas in the United States and which Puerto Rico joined in the second quarter of 2014. The prices are published for users through a cost of living calculator, which makes it possible to compare the cost of living in Puerto Rico versus that of another city in the United States and vice versa. The Puerto Rico Cost of Living Index includes average prices three times a year for the following 56 product categories: ribeye steak, ground beef, sausage, fried chicken, canned tuna, whole milk, eggs, margarine, parmesan cheese, potatoes, guineos, lettuce, specialty bread, china juice, coffee, sugar, corn flake cereal, green peas, peaches, face towels, dishwashing detergent, extra virgin olive oil, frozen food, fresh corn, frozen whole corn, potatoes soft drinks, apartment rental, house price, energy total, landline, tire balancing, gasoline, visit to an optometrist, visit to a doctor, dental cleaning, ibuprofen, Lantus insulin, hamburger, pizza, fried chicken, men's cut, hair care for women (washing, drying and trimming), toothpaste, hair shampoo, dry cleaning for men's label, men's shirt, pants for boys, pants for women, washing machine, subscription to newspapers, movies, bowling, tennis balls, veterinary services, beer and wine.
Describe the population of eligible and insured beneficiaries of the Government Health Plan (MI Salud). It is distributed by regions and municipalities of Puerto Rico and gender.

The report presents data on complaints from employees of private companies or public corporations disaggregated by causes included in state and federal laws. The causes include: national origin, sex, race, religion, age, disability, marriage, politics, retaliation, criminal record, breastfeeding. It is produced on an annual basis, using the state fiscal year. The total number of causes is greater than the total number of complaints because a complaint can have more than one cause.

The report collects the average daily correctional population broken down by region, institution and levels of custody. In addition, it is grouped into summary and sentenced; female and young adults (16 to 21 years old).
It presents the number of motor vehicles registered with the Department of Transportation and Public Works, by category of vehicles (private, public, taxis, trailers, motorbikes, etc.) for each of the 78 municipalities of Puerto Rico.
Information on the incidence, cases and distribution of type 1 diabetes in the pediatric population of Puerto Rico.

Informe oficial del Departamento de Educación de Puerto Rico que presenta los resultados de las pruebas estandarizadas CRECE para el año académico 2025-2026. El reporte destaca un progreso académico sostenido, evidenciando aumentos en la proficiencia de los estudiantes en las cuatro materias evaluadas (Español, Matemáticas, Inglés y Ciencias) respecto al ciclo anterior. Además, incluye un análisis del crecimiento histórico a nivel isla y una comparativa de Puerto Rico respecto a los estados de Estados Unidos.
These indicators provide the total production and sales of cement in Puerto Rico. These totals are measured in 94 lb bags.
.svg)
It presents statistics on deaths that occurred in road accidents. It includes breakdowns by month, day of the week, region, municipality, highway patrol units, age, gender, type of victims (Driver, Pedestrian, Passenger, Motorcyclist, Cyclist and Rider), time of the accident, and in some cases by calendar day. All accidents reported by the Bureau of Highway, Highway and Urban Train Patrol are included, even if they have not been reported through a complaint.
.png)
.png)
.png)
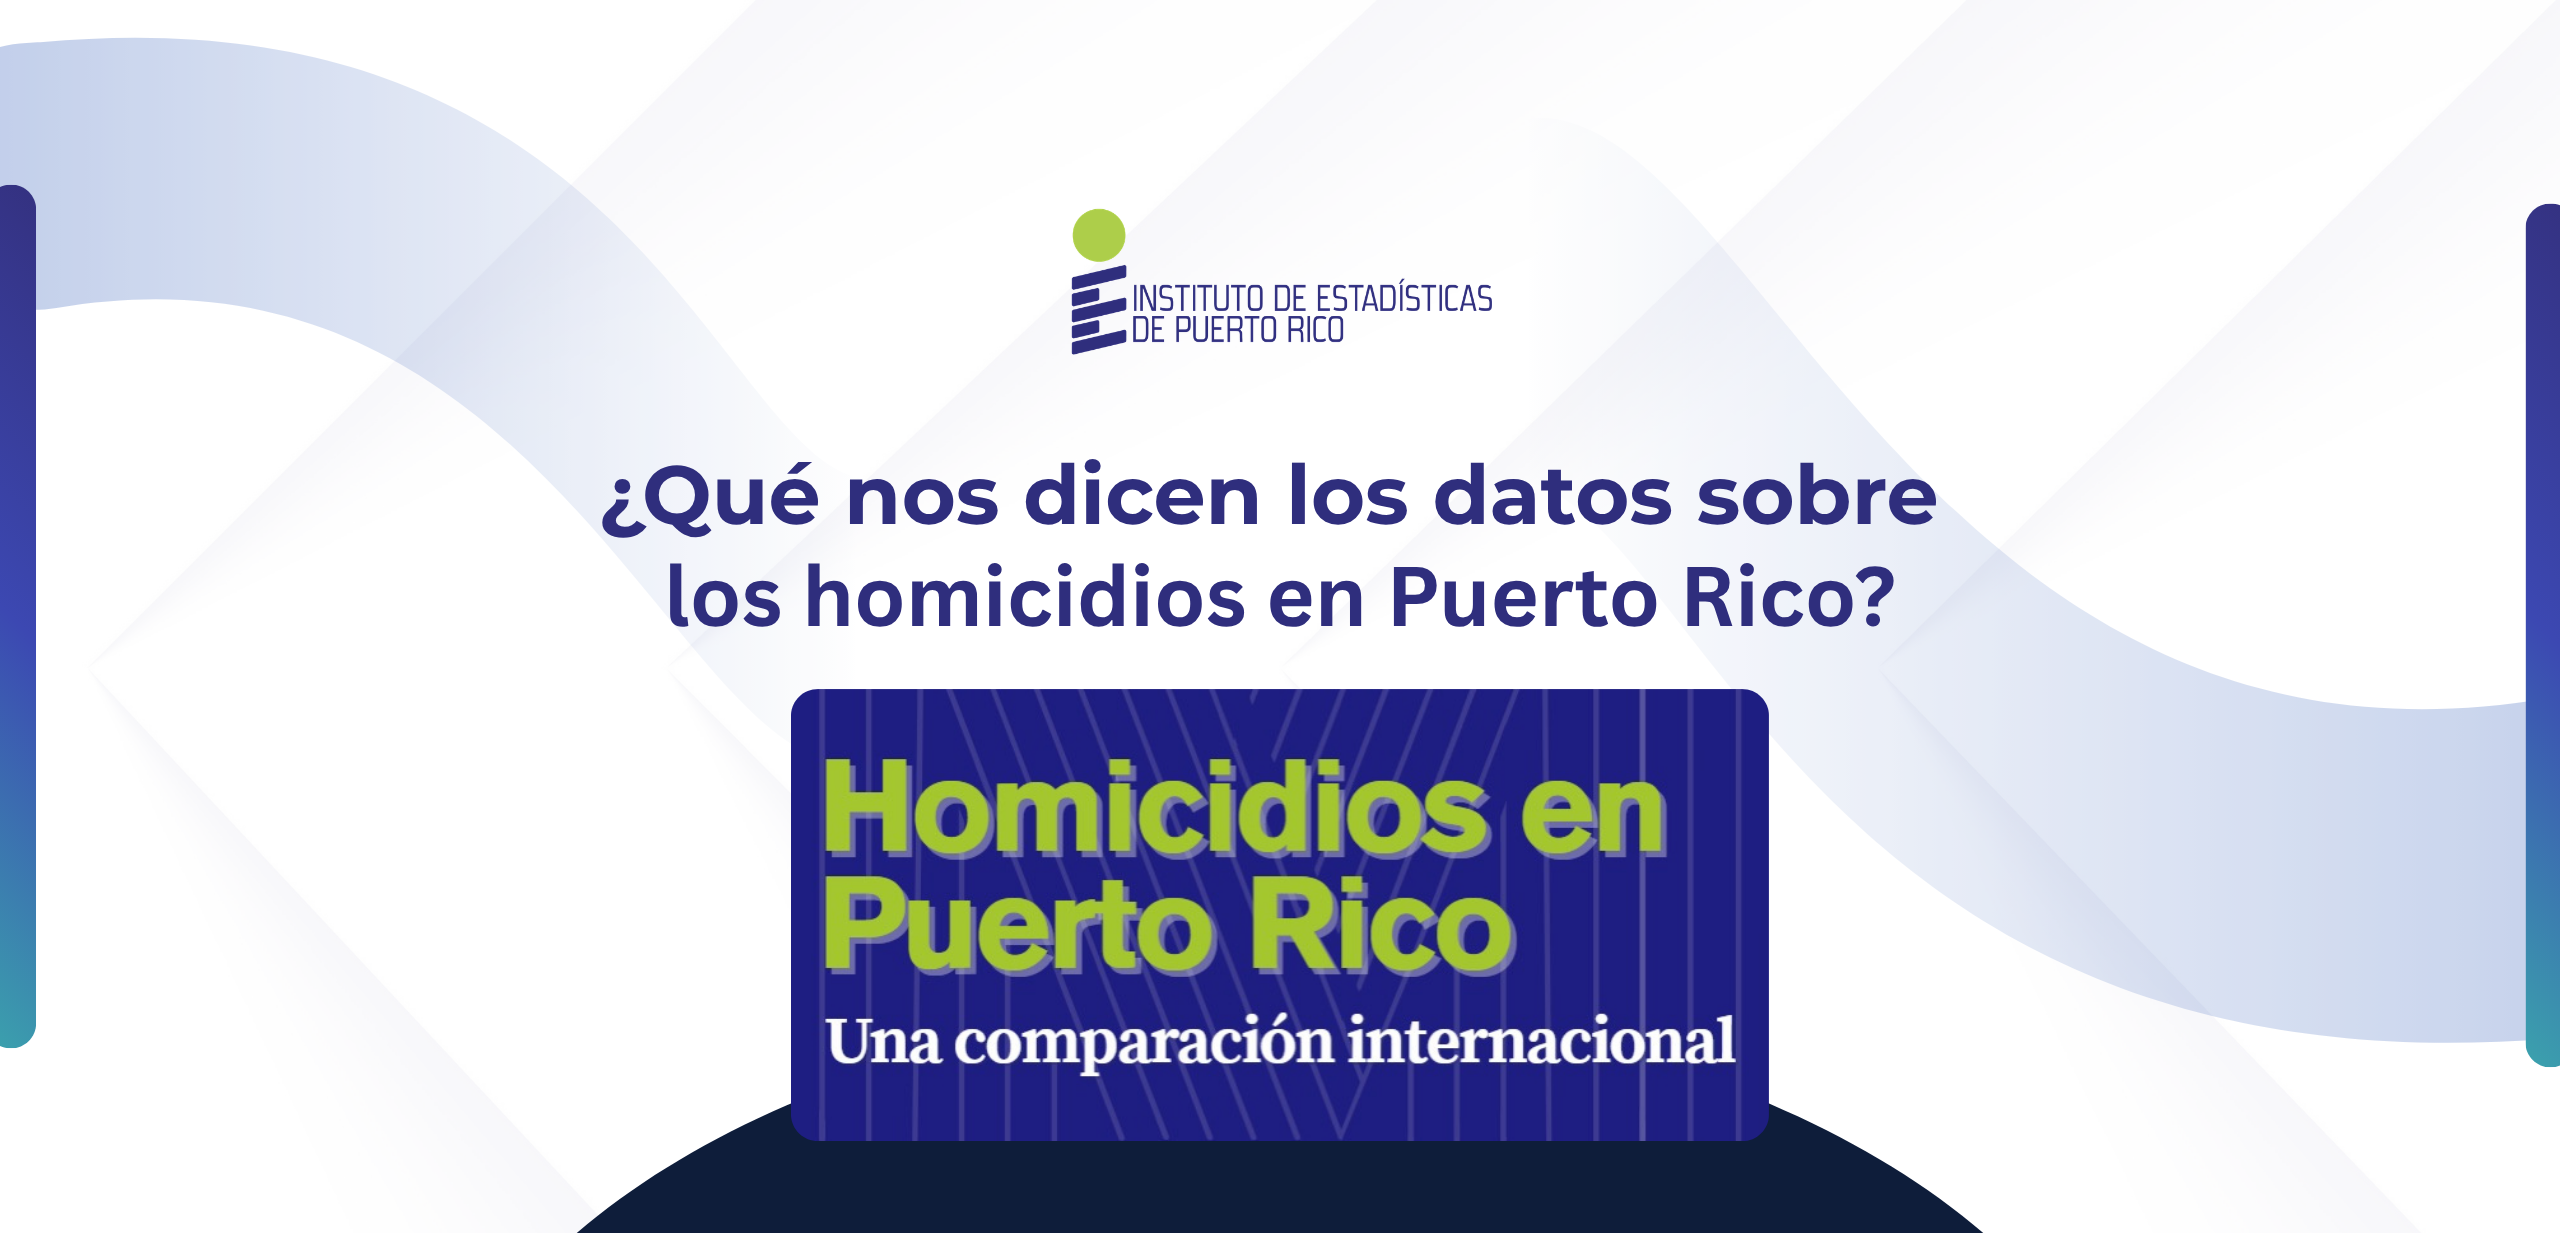

Key Homicide Data in Puerto Rico: An Analysis in the International Context
The Puerto Rico Violent Death Reporting System (PRVDRS), attached to the Puerto Rico Institute of Statistics, has published a new information capsule with 2024 data analyzing the archipelago's situation compared to the rest of the world.
Below, we highlight the most relevant findings regarding the incidence of homicides in Puerto Rico and worldwide:
Puerto Rico's Position in the Region
- Homicide Rate: Puerto Rico recorded a crude rate of 15.2 homicides per 100,000 inhabitants.
- Caribbean Ranking: Among the 11 countries and jurisdictions analyzed in the Caribbean region, Puerto Rico ranks 10th, placing below jurisdictions such as the Turks and Caicos Islands (103.2), Haiti (64.3), Trinidad and Tobago (41.5), and Jamaica (40.4).
- Compared to the Regional Average: Although Puerto Rico's figure (15.2) sits below the Latin America and Caribbean average (19.3), it remains nearly three times higher than the global homicide average (5.1 per 100,000 inhabitants).
Firearm Prevalence: Puerto Rico – The Second Highest Figure in the Region
- 89.2% of Homicides Involve Firearms: Nearly 9 out of 10 homicides in the archipelago are committed using a firearm.
- Regional Leader: Alongside Saint Kitts and Nevis (89.3%), Puerto Rico presented the highest proportion of firearm homicides in all of Latin America and the Caribbean.
- International Contrast: This figure far exceeds the global average for firearm homicides (67.2%). The document emphasizes that a large portion of these incidents in Puerto Rico is related to organized crime.
Comparison by Gender and Racial Groups (Puerto Rico vs. United States)
When adjusting rates by age and comparing Puerto Rico's population with various groups in the U.S., significant disparities by sex are observed:
- Men: Men in Puerto Rico present the second-highest homicide risk rate (32.5 per 100,000 inhabitants), surpassed only by Black men in the U.S. (41.5). This figure is considerably higher than that of Hispanic men (8.6) and White men (3.6) in the U.S.
- Women: The adjusted rate for women in Puerto Rico is 3.9 per 100,000 inhabitants, placing below the risk level observed in Black women (6.9) and Native American women (5.9) in the U.S.
For more information, download the information capsule in the Access the Document section.
About the Data Source
The PRVDRS was established in 2016 with support from the Centers for Disease Control and Prevention (CDC). The system consolidates and validates information from the Bureau of Forensic Sciences, the Puerto Rico Police, and the Demographic Registry of the Department of Health to generate rigorous and internationally comparable statistics.
Links of interest: Puerto Rico Violent Death Reporting System
To direct the Senate of Puerto Rico’s Committee on Finance, Budget, and PROMESA to conduct a comprehensive investigation into the excise tax on crude oil and its derivatives, known as the “crudita”; its legislative origin, tax evolution, and economic impact on consumers; its relationship to the financing of the Highways and Transportation Authority; the financial commitments associated with said tax within the public debt Adjustment Plan; its integration into certified fiscal plans; and any other matter related to the tax policy applicable to oil and fuels in Puerto Rico.
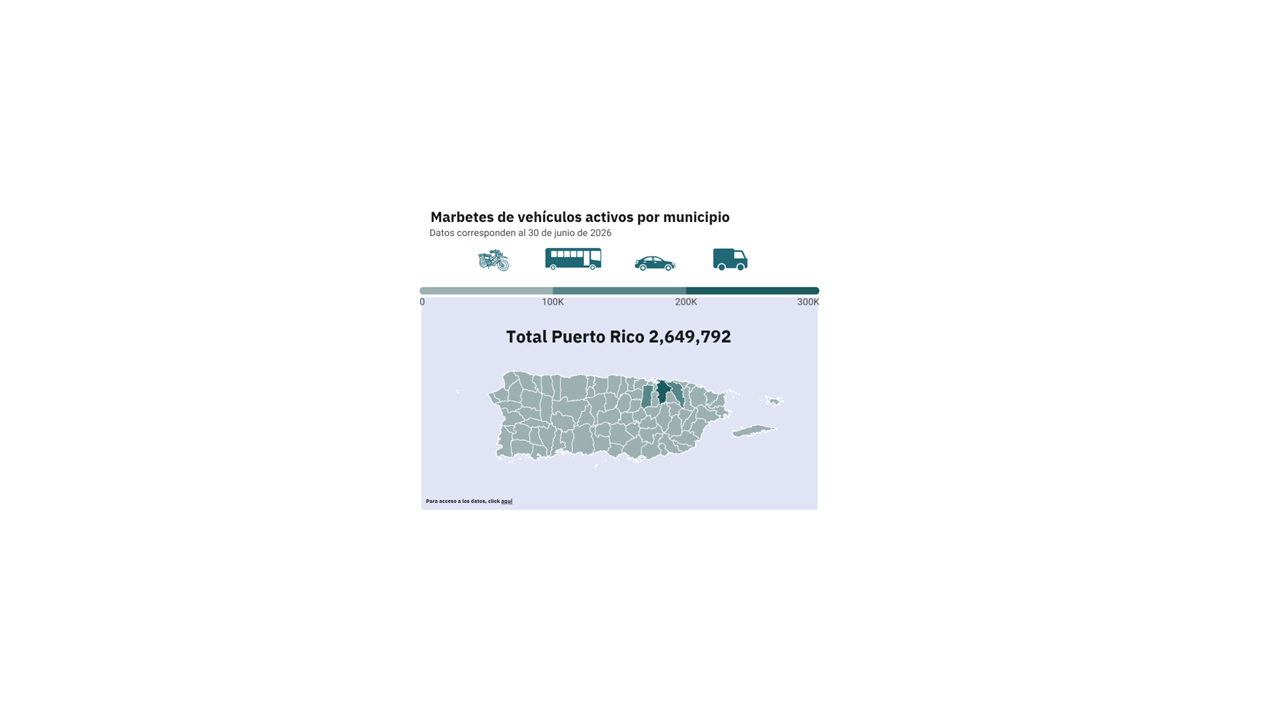
¿Cuántos vehículos hay en Puerto Rico?
Al 30 de junio de 2026, Puerto Rico cuenta con 2,649,792 vehículos con marbete activo, según datos del Departamento de Transportación y Obras Públicas (DTOP). Esta cifra incluye distintos tipos de vehículos, entre ellos automóviles, camiones, motocicletas, ómnibus y arrastres registrados a través de los 78 municipios.
Los automóviles representan la mayor parte de los vehículos en Puerto Rico, con 2,106,223 unidades, equivalentes a cerca del 79.5 % del total. Le siguen los camiones, con 442,017, las motocicletas, con 49,159, los arrastres, con 47,469, y los ómnibus, con 4,924.
Al observar la distribución por municipio, San Juan encabeza la lista con 317,926 vehículos. Le siguen Bayamón, con 140,186, y Carolina, con 133,667. Los tres municipios suman 591,779 vehículos, lo que representa aproximadamente el 22.3 % del total de Puerto Rico.
Estas estadísticas permiten conocer la cantidad, composición y distribución territorial de los vehículos en Puerto Rico. La información aporta al análisis de temas relacionados con movilidad, transportación, infraestructura vial y la planificación urbana.
Para acceder a los datos, click aquí
Preparado por: Instituto de Estadísticas de Puerto Rico
Fuente: Departamento de Transportación y Obras Públicas (DTOP). Datos al 30 de junio de 2026.

En el marco del décimo aniversario del Sistema de Notificación de Muertes Violentas de Puerto Rico (PRVDRS), compartimos una nueva cápsula informativa que presenta datos relevantes sobre el suicidio en Puerto Rico y el mundo.
Establecido en 2016 con el apoyo de los Centros para el Control y la Prevención de Enfermedades (CDC), el PRVDRS integra información de distintas fuentes oficiales para ampliar el conocimiento sobre las muertes violentas y apoyar la toma de decisiones basada en evidencia.
Hoy, 10 de septiembre, Día Mundial para la Prevención del Suicidio, destacamos algunos datos que nos ayudan a comprender mejor esta realidad:
• Entre 2017 y 2024, se registraron 1,925 muertes por suicidio en Puerto Rico, para un promedio de 241 al año.
• En 2021, el suicidio fue la tercera causa de muerte entre los jóvenes de 15 a 29 años, tanto en Puerto Rico como a nivel mundial.
• El suicidio afecta de manera desproporcionada a los hombres.
Conocer los datos es fundamental para desarrollar estrategias de prevención y promover una conversación informada. Hablar salva vidas.
Si usted o alguien que conoce necesita apoyo, puede llamar o enviar un mensaje al 988 o comunicarse con la Línea PAS de ASSMCA al 1-800-981-0023
#estadisticasPR #statisticsPR

Access Episode 4 of the second season of The Institute of Statistics: The Podcast!
In this episode, Alejandro Rodríguez-Putnam, a researcher at the Center for Social Epidemiology and Population Health at the University of Michigan School of Public Health, discusses the prevention of firearm-related deaths.
Access episode 4 at: https://open.spotify.com/episode/7f0PSnfPO26zBP1aG2tQAA.
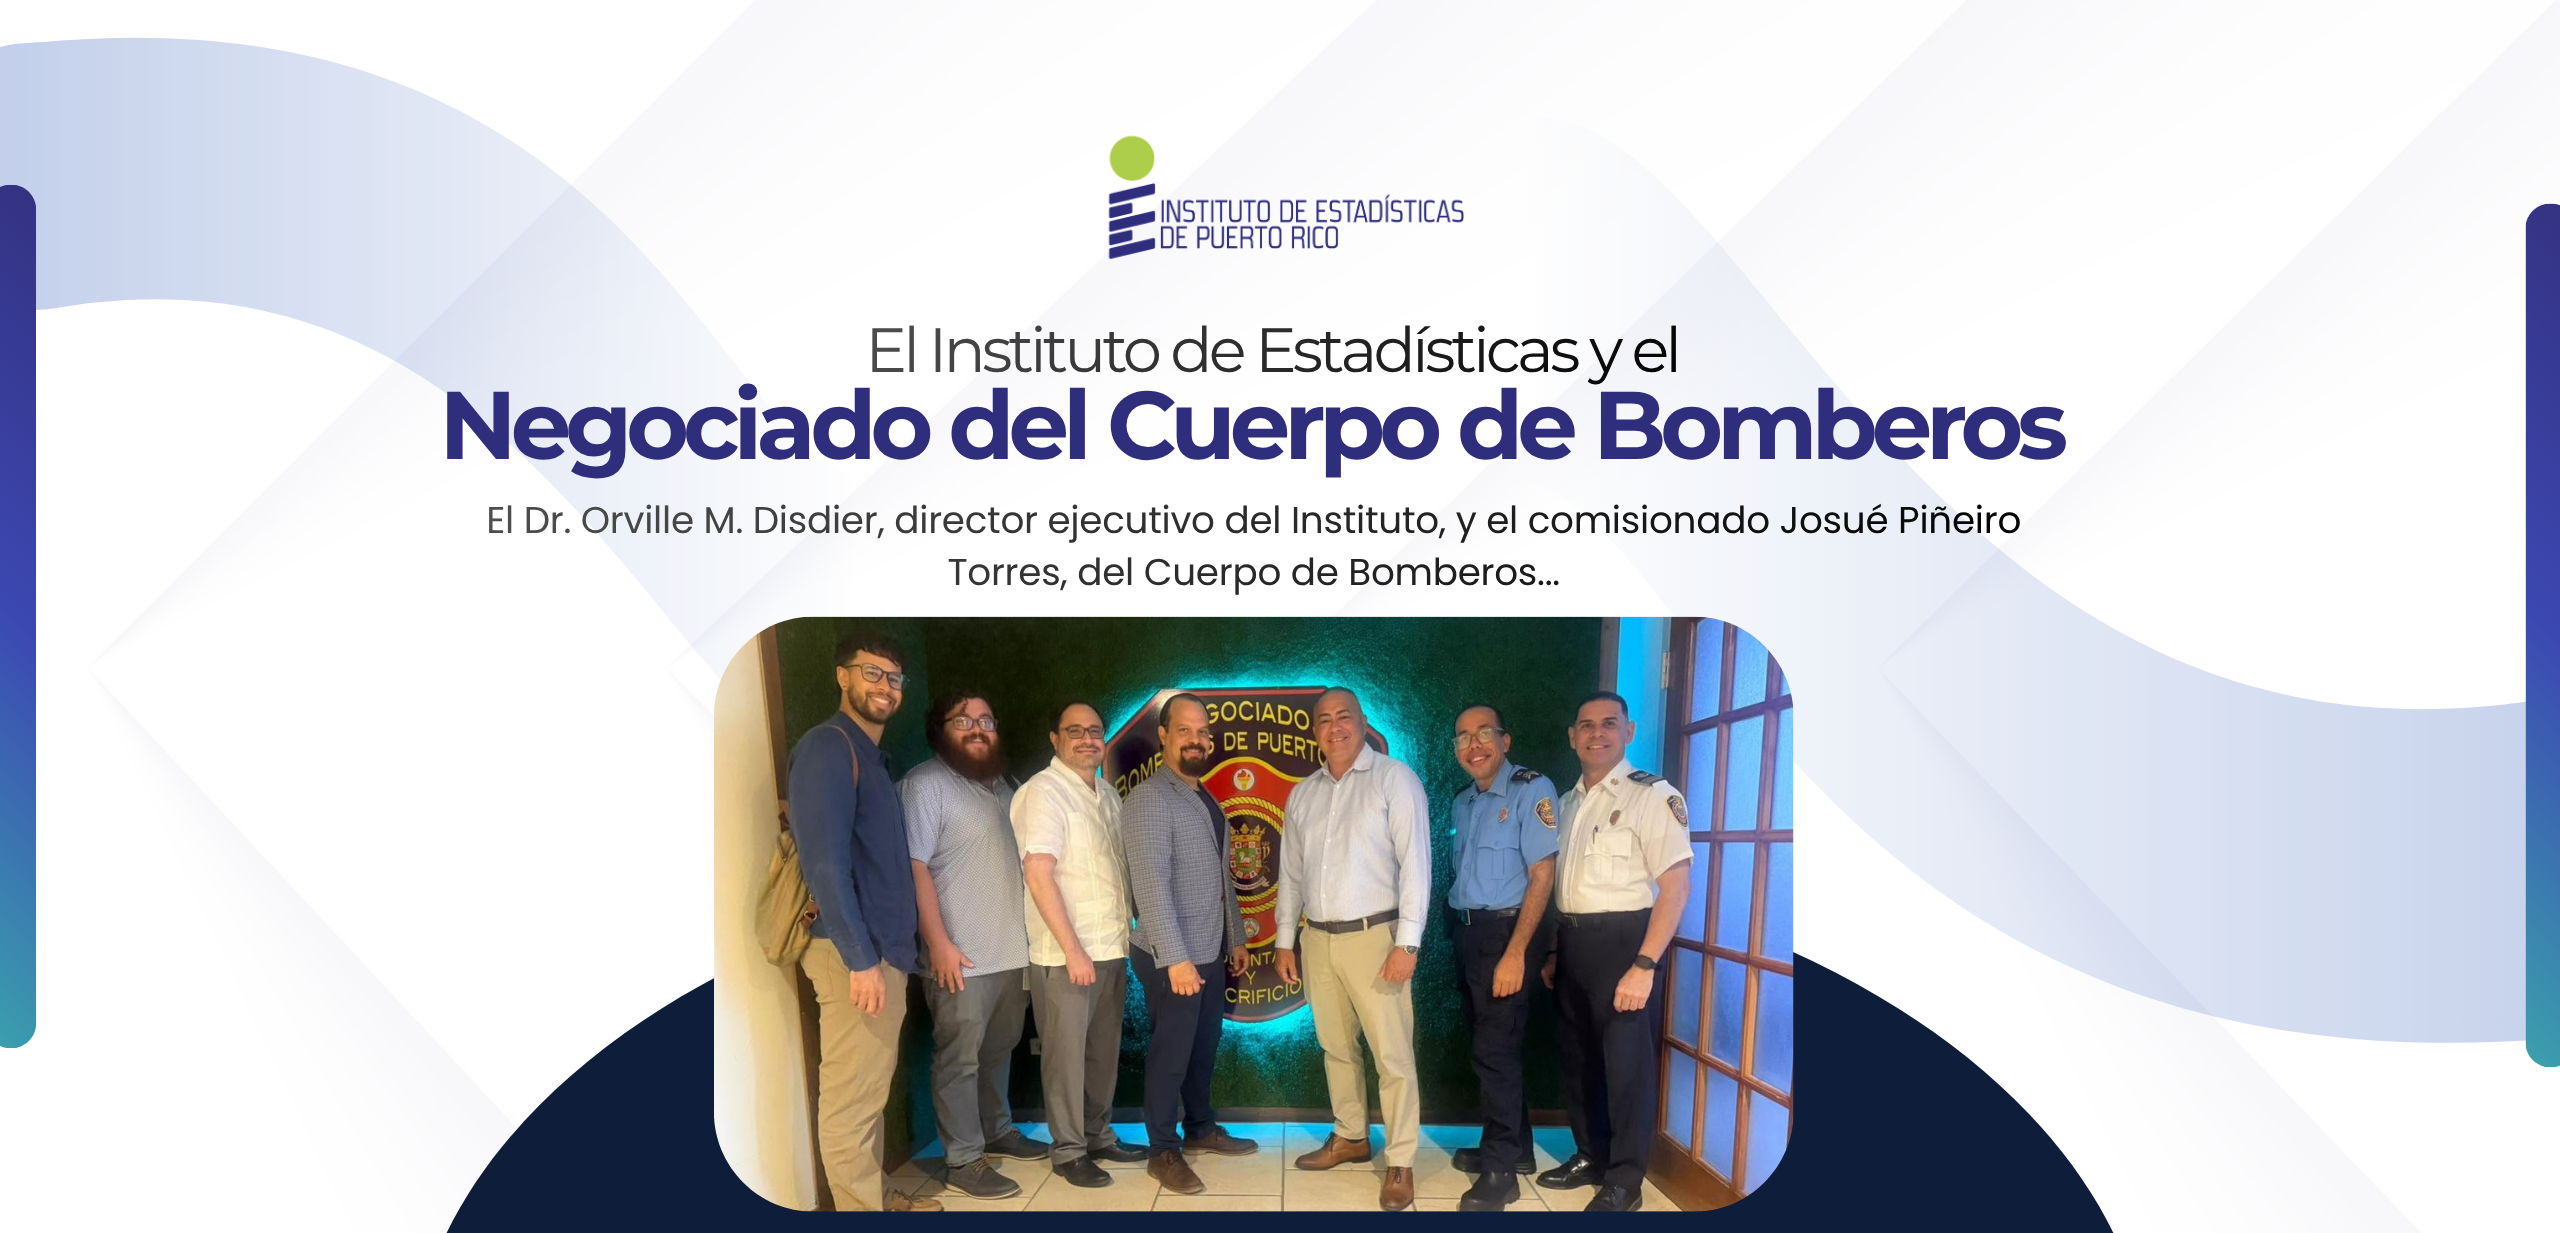
The Puerto Rico Institute of Statistics and the Fire Bureau have coordinated strategies to improve the Bureau's statistical reporting.
Dr. Orville M. Disdier Flores, Executive Director of the Institute, and Commissioner Josué Piñeiro Torres of the Fire Bureau led a meeting that resulted in a work plan to improve the processes for collecting, analyzing, and producing the statistics and reports generated by the Bureau.
Producing more comprehensive, reliable, and easily accessible statistics will promote better decision-making and service optimization.
Access the infographic on incidents reported by the Puerto Rico Fire Bureau: Incidents reported by the Puerto Rico Fire Bureau (2022-2025).
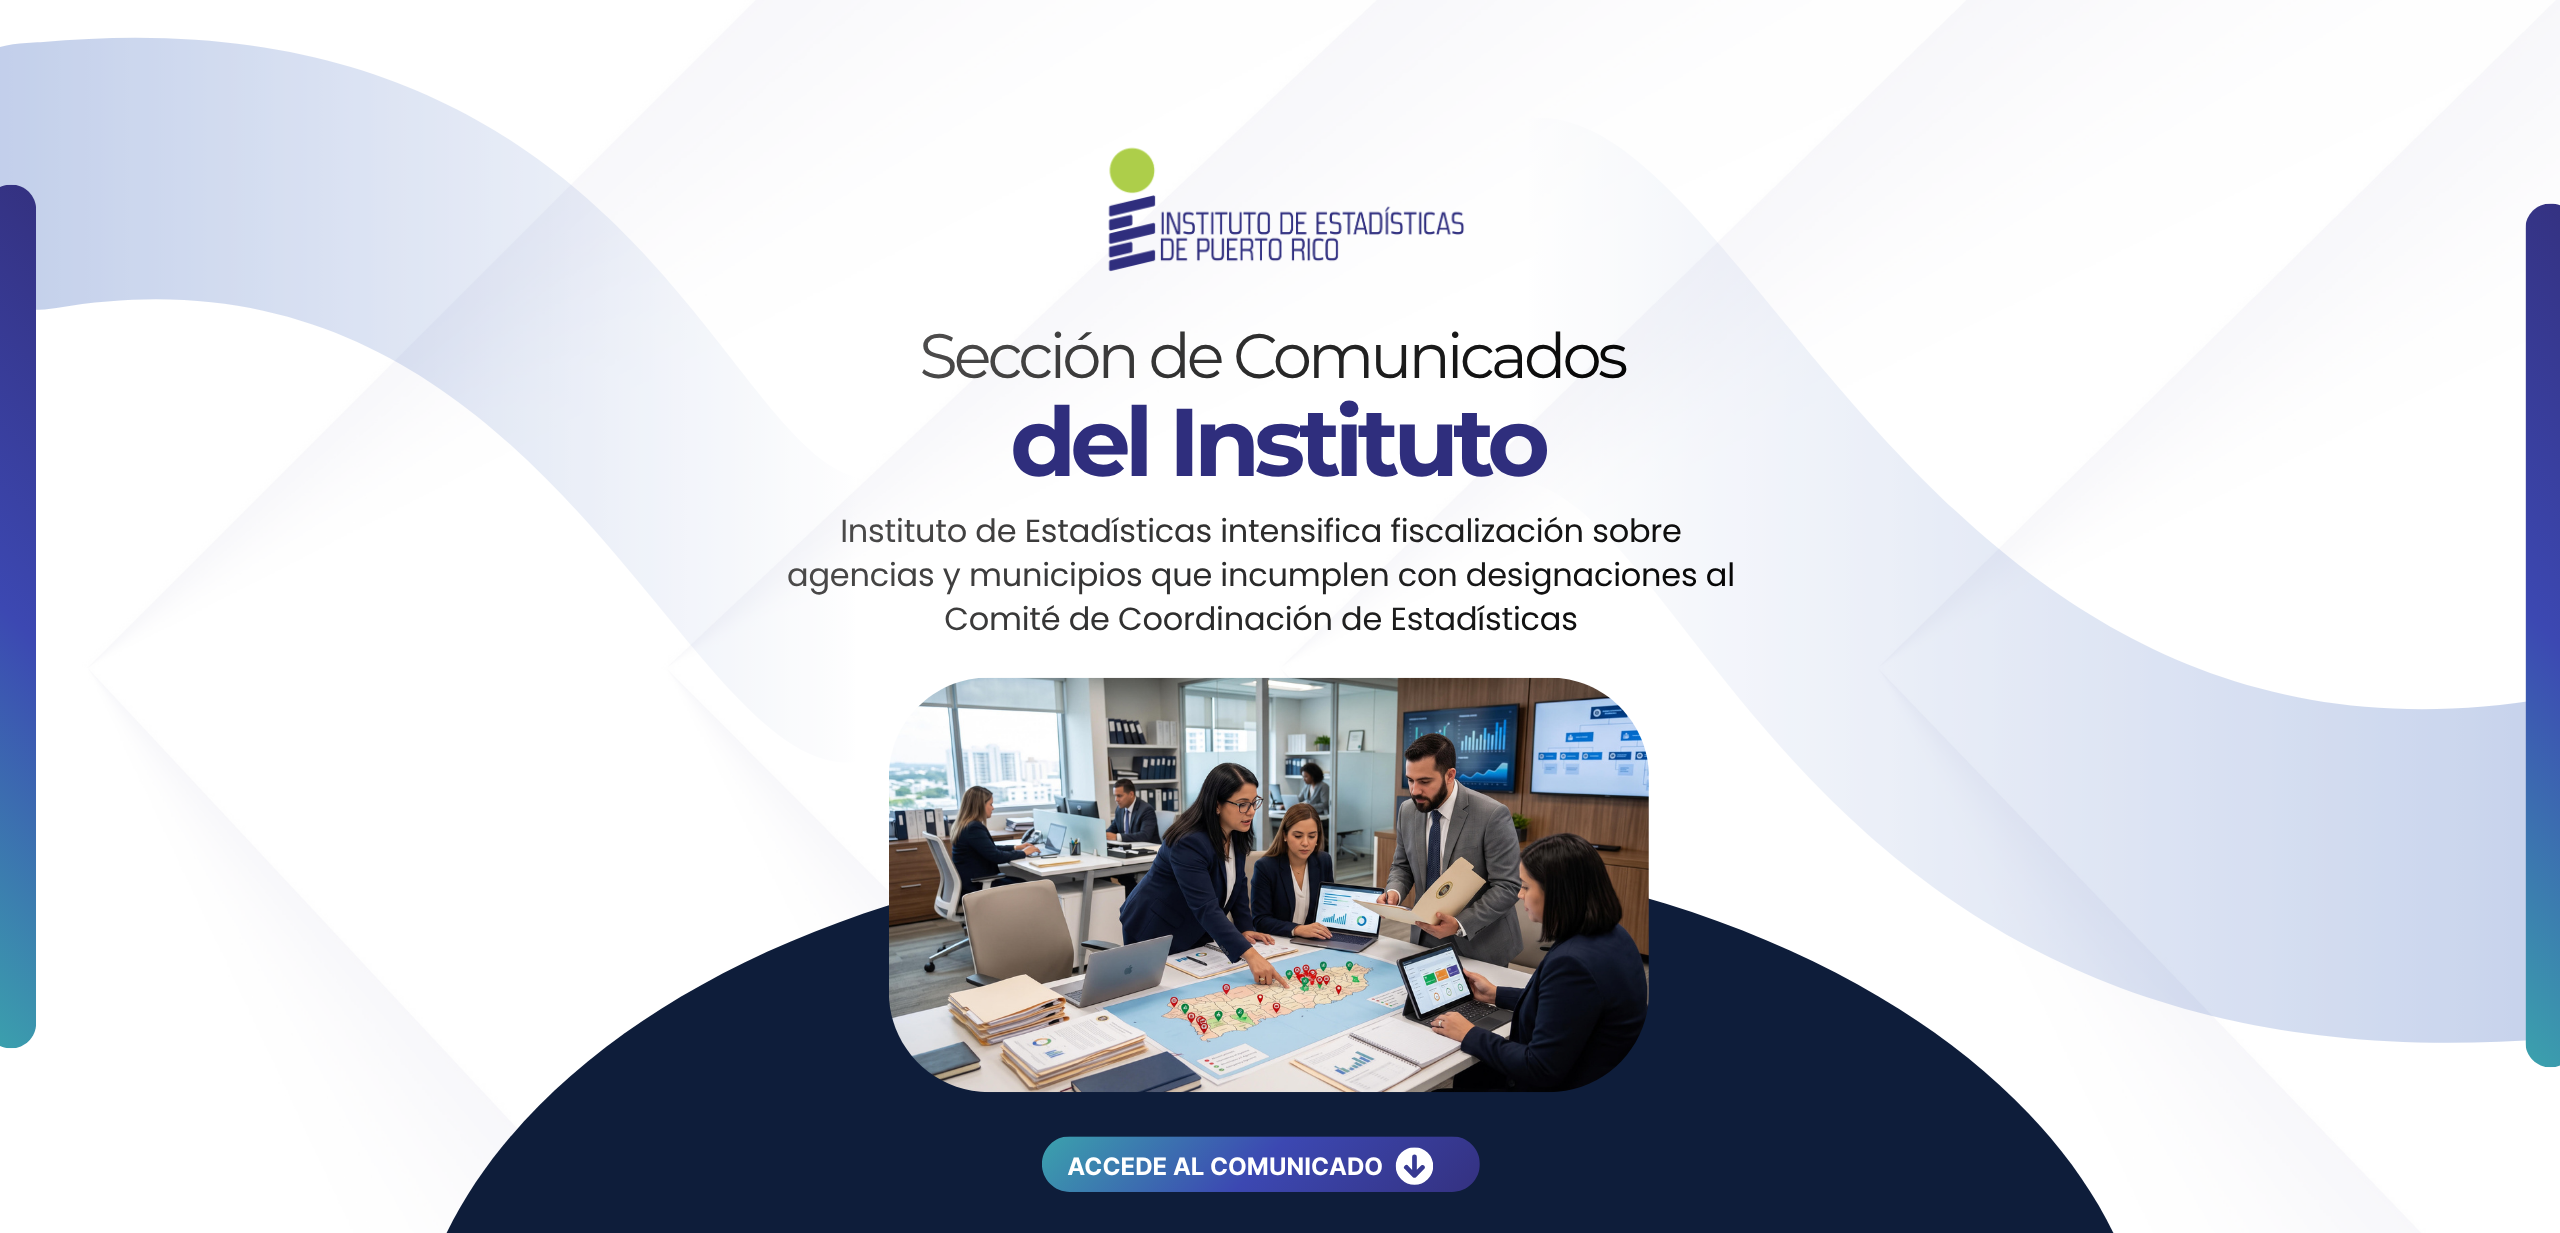
39.7% of municipalities and 14.8% of executive branch agencies are currently non-compliant
The Puerto Rico Institute of Statistics (Institute) has intensified its oversight of agencies, public entities, and municipalities that have failed to fulfill their duty to appoint a representative to the Statistics Coordination Committee (CCE). As part of this effort, the Institute has published Special Report 2027-01, which identifies 16 executive branch agencies and entities, as well as 31 municipalities, that remained non-compliant as of August 31, 2026, despite requests and follow-ups made since January. These entities must complete their appointments immediately or face further findings, potential administrative fines, and other legal actions.
Under the Institute’s organic law, the Statistics Coordination Committee serves as the government’s advisory, coordinating, and participatory body for Puerto Rico’s Statistical Production Service. This body is responsible for ensuring the flow and continuity of statistical data and information, resolving issues regarding access to such data, and proposing solutions to problems related to the operation of statistical units. Furthermore, the Statistics Coordination Committee Regulations stipulate that, upon request by the Institute’s Executive Directorate, the head of each government entity must fulfill the duty of appointing the CCE member who will represent that entity on the Committee.
Special Report 2027-01 shows that 85.2% of executive branch agencies and public entities are in compliance. Conversely, the compliance rate for municipalities is lower, at 60.3%. Meanwhile, 14.8% of executive branch agencies and public entities are non-compliant, as are 39.7% of municipalities.
“Compliance with CCE appointments is an essential requirement, as it ensures that Puerto Rico has access to complete, reliable, and universally accessible statistics. For this reason, since the beginning of 2026, the Institute has conducted an extraordinary campaign to promote and monitor compliance. Special Report 2027-01 on CCE appointments reflects a considerable increase in designations, as previously less than 50% of agencies had appointments and very few municipalities had designated representatives. Despite this progress, the report also shows that there are still agencies in non-compliance, and, in particular, many municipalities that have yet to meet this requirement,” stated Dr. Orville M. Disdier, Executive Director of the Institute of Statistics.
Details regarding which entities and municipalities are non-compliant (having failed to meet the appointment requirement) can be found in Section 3 of Special Report 2027-01. Additionally, Section 2 lists the executive branch entities and municipalities that are in compliance (having met the appointment requirement).
Agencies and municipalities that have already fulfilled their CCE appointment requirements do not need to take any further action at this time. However, those that are non-compliant must immediately complete and submit the appointment form (FormularioDesignaciónCCE-31-10-2025) to Dr. Idania Rodríguez Ayuso, the Institute’s Deputy Executive Director (idania.rodriguez@estadisticas.pr), with a copy to Jacobo Orenstein Cardona, the Institute’s Executive Assistant (jacobo.orenstein@estadisticas.pr).
“We urge all executive branch agencies and entities, as well as all municipalities that remain non-compliant, to take immediate action to avoid further findings and potential fines,” added Disdier.
You can access the full report at: Special report on the compliance of agencies and municipalities with appointments to the Statistics Coordination Committee - 2027-01.
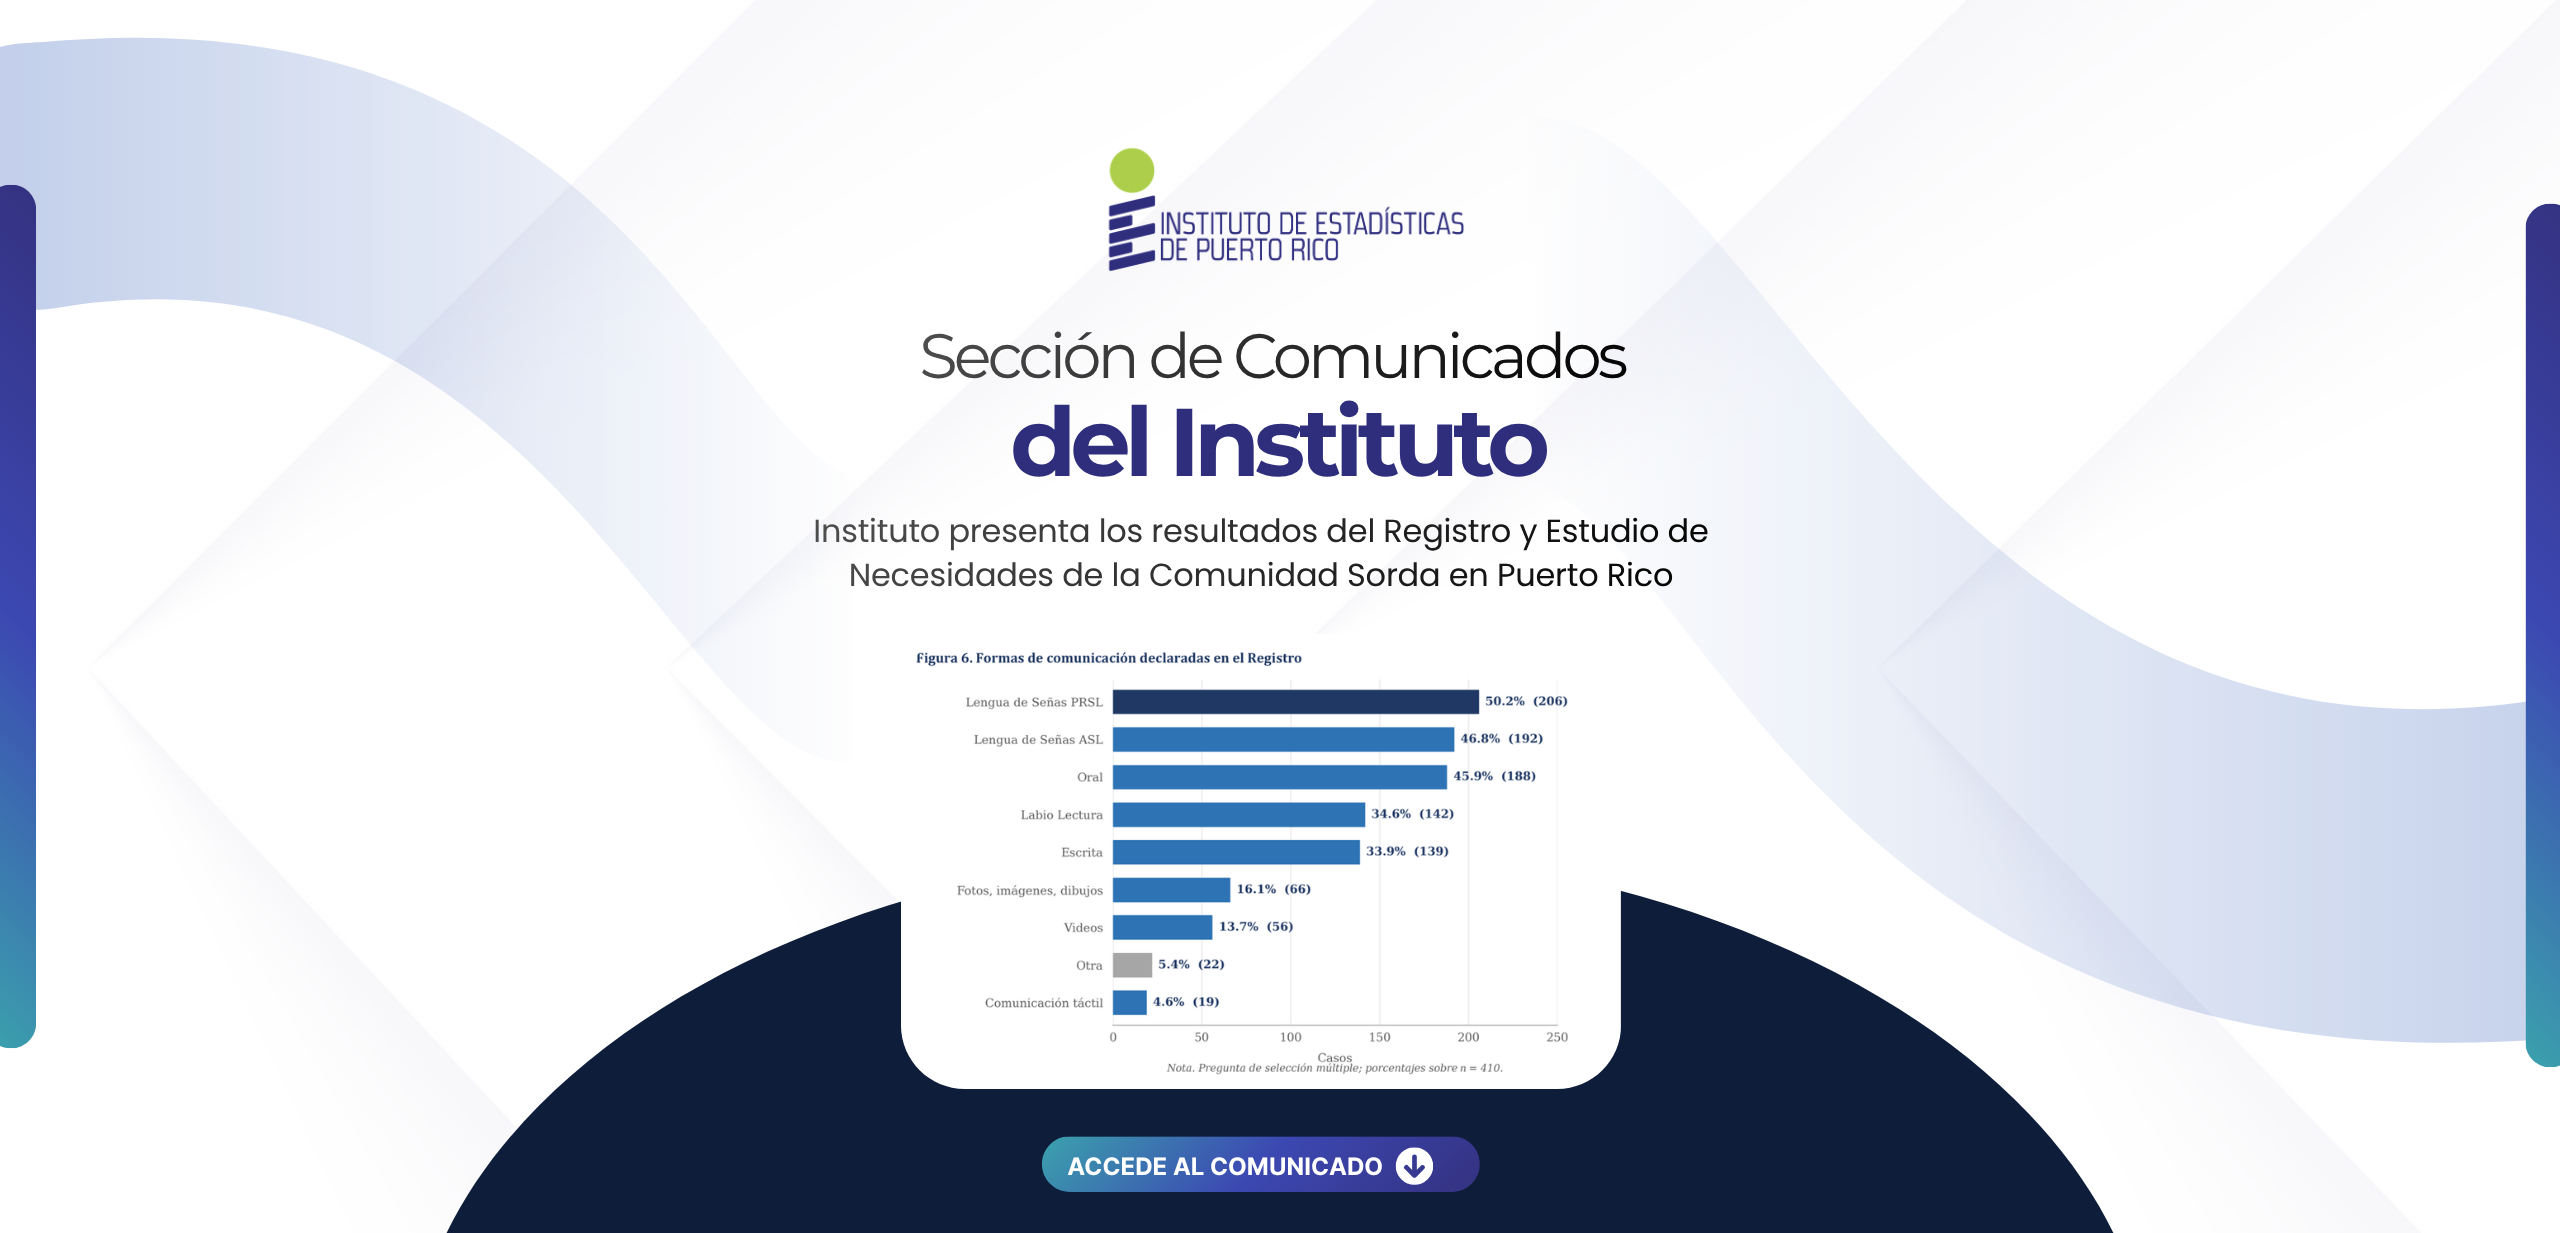
69% of those who evaluated their communication experience in healthcare services rated it as fair or poor.
The Puerto Rico Institute of Statistics presented the results of the Registry and Study of Needs of the Deaf Community in Puerto Rico for the period of January 13 to July 24, 2026. The results underscore the importance of having sign language interpreters and trained staff to facilitate this population's access to essential services. According to the report, 89% of those who responded to the needs questionnaire indicated they had visited a hospital, clinic, or doctor's office within the last year. Among the issues noted when evaluating communication in these settings were the lack of interpreters and the absence of trained staff.
Likewise, when asked what they primarily need when attending an appointment at a government office or healthcare service, respondents mentioned the need for trained staff, the availability of in-person interpreters, and the provision of forms accessible to the Deaf.
“These findings allow us to identify concrete needs to continue strengthening the accessibility of services received by the Deaf or hard-of-hearing community. Having trained staff, sign language interpreters, and accessible communication tools can make a significant difference in people's experiences and their ability to receive the guidance and services they need,” said the Institute of Statistics' executive director, Dr. Orville M. Disdier.
Key findings include:
• 89% indicated they had visited a hospital, health clinic, or doctor's office within the last year.
• 71% reported using hearing aids or a cochlear implant.
• 69% of those who evaluated their communication experience in healthcare services rated it as fair or poor.
• 67% of those who responded to the Registry indicated they have been deaf since birth.
• 62% indicated they are not currently employed.
• 61% noted they do not have access to video relay services.
• Puerto Rican Sign Language and American Sign Language accounted for 398 mentions among the forms of communication used by those enrolled in the Registry.
The results are part of the official report prepared by the Institute in compliance with Executive Order OE-2026-002, issued by Governor Jenniffer González Colón. The document was submitted to the governor on August 12, 2026, as requested and established in the executive order.
The executive order tasked the Institute, in collaboration with various government agencies and entities, with making a formal effort to collect information on the Deaf community in Puerto Rico, including its characteristics, particularities, and forms of communication. As part of this mandate, the Institute developed two components: the Registry of Deaf Persons in Puerto Rico and the Needs Questionnaire for the Deaf Community. This builds upon the effort previously undertaken by the Institute, which culminated in the First Study of Needs of the Deaf Community in Puerto Rico, published on July 21, 2022, and available on the Institute's website.
During the analyzed period, the Registry received 803 entries, 410 of which met the established inclusion criteria. For its part, the Needs Questionnaire reached 103 processed responses.
“Understanding how this population communicates and what their needs are is fundamental to guiding decision-making and developing initiatives that respond to their reality. This effort provides us with a foundation to continue expanding the available information and promoting increasingly accessible services,” added Disdier.
“These results describe the characteristics and experiences of the people who participated voluntarily. While they should not yet be used to make estimates for the entire Deaf community in Puerto Rico or for comparisons between municipalities, they do allow us to begin formulating public policy. In this sense, we recommend expanding the project's scope, strengthening the collaboration of the agencies involved, developing a municipal outreach plan, and continuing to collect and expand the data,” explained Joselyn Santiago, one of the study's lead authors.
Although the executive order has expired, the Institute will continue to expand and update the Registry and the Needs Questionnaire until at least the end of December 2026. This will allow for the inclusion of more participants, increased geographic representation, and the strengthening of available information to continue supporting the development of public policies and services aimed at the Deaf community.
“This effort is only the beginning, as we will continue to strengthen and expand both the registry and the needs study. At the Institute, we will continue to seek the necessary resources to allow us to reach more people within the Deaf communities who wish and need to be heard and represented,” said Dr. Disdier.
The full report is available through the Puerto Rico Institute of Statistics portal at: Registry and Study of Needs of the Deaf Community in Puerto Rico.
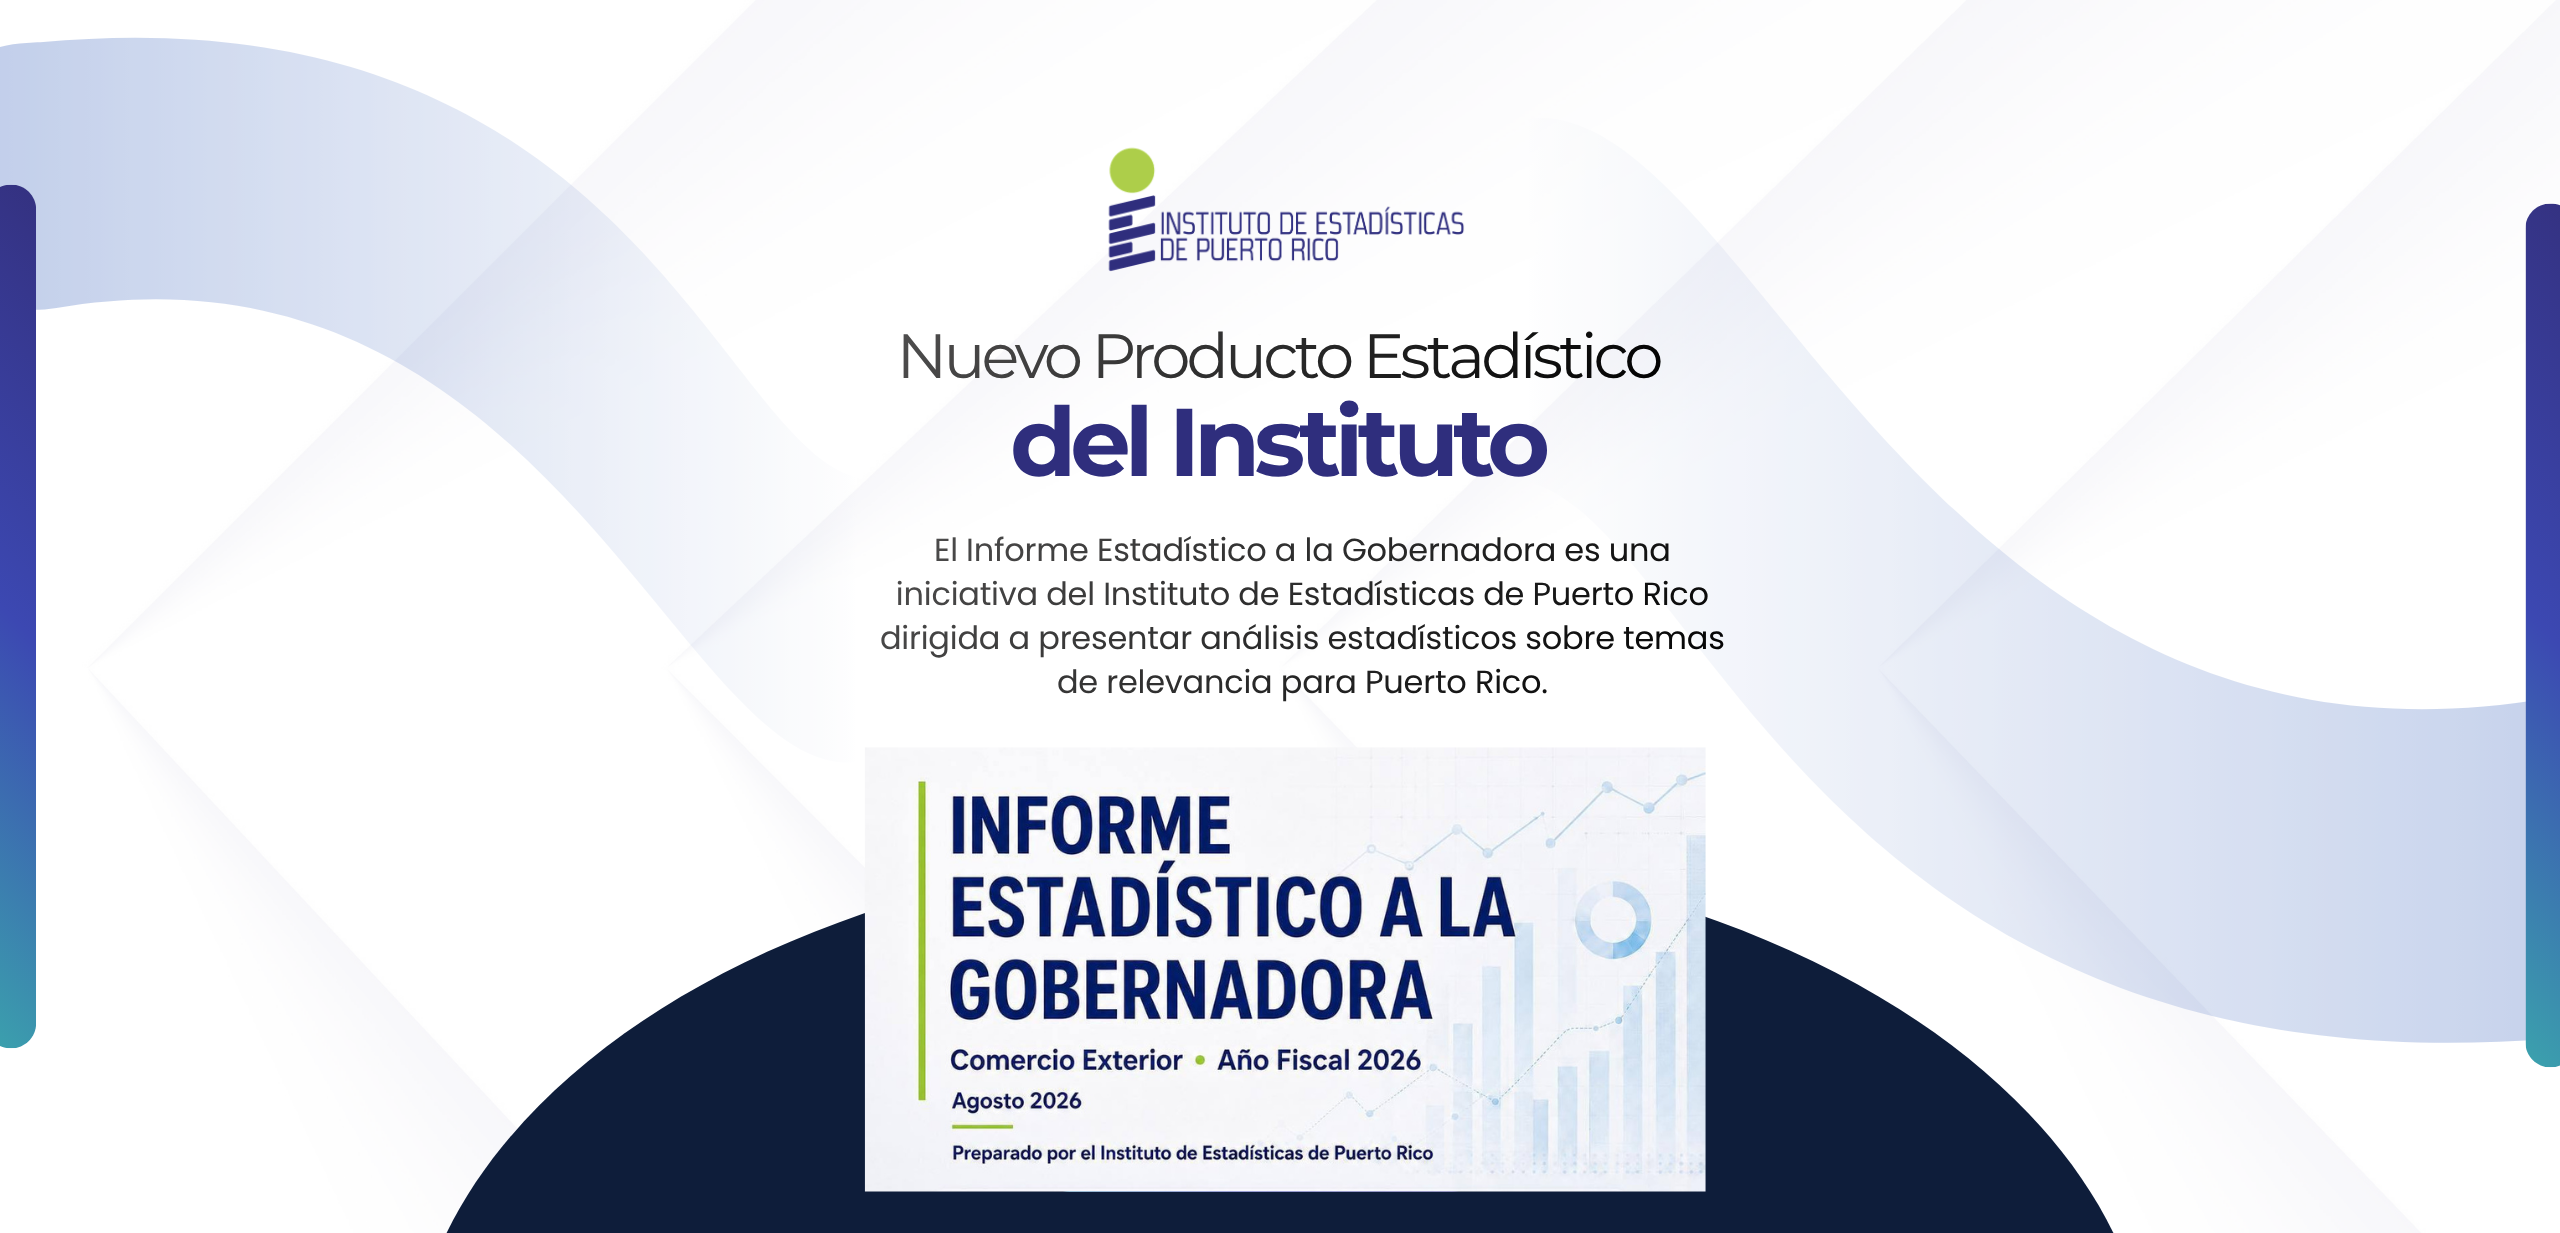
Statistical Report to the Governor - Foreign Trade Fiscal Year 2026
The Statistical Report to the Governor is an initiative by the Puerto Rico Institute of Statistics aimed at presenting statistical analyses on topics of relevance to Puerto Rico.
These reports examine data and indicators across various contexts, disciplines, and subject areas, with the goal of providing objective, evidence-based information to help understand matters of public interest.
Each edition addresses a specific theme through the analysis, integration, and interpretation of various data sources. This initiative seeks to strengthen the use of statistics as a tool for decision-making, public policy formulation, and the analysis of Puerto Rico's economic and social reality.
Access this first edition, on Foreign Trade for Fiscal Year 2026, via the following link: https://www.estadisticas.pr.gov/blogposts/informe-estadistico-a-la-gobernadora---comercio-exterior-ano-fiscal-2026.
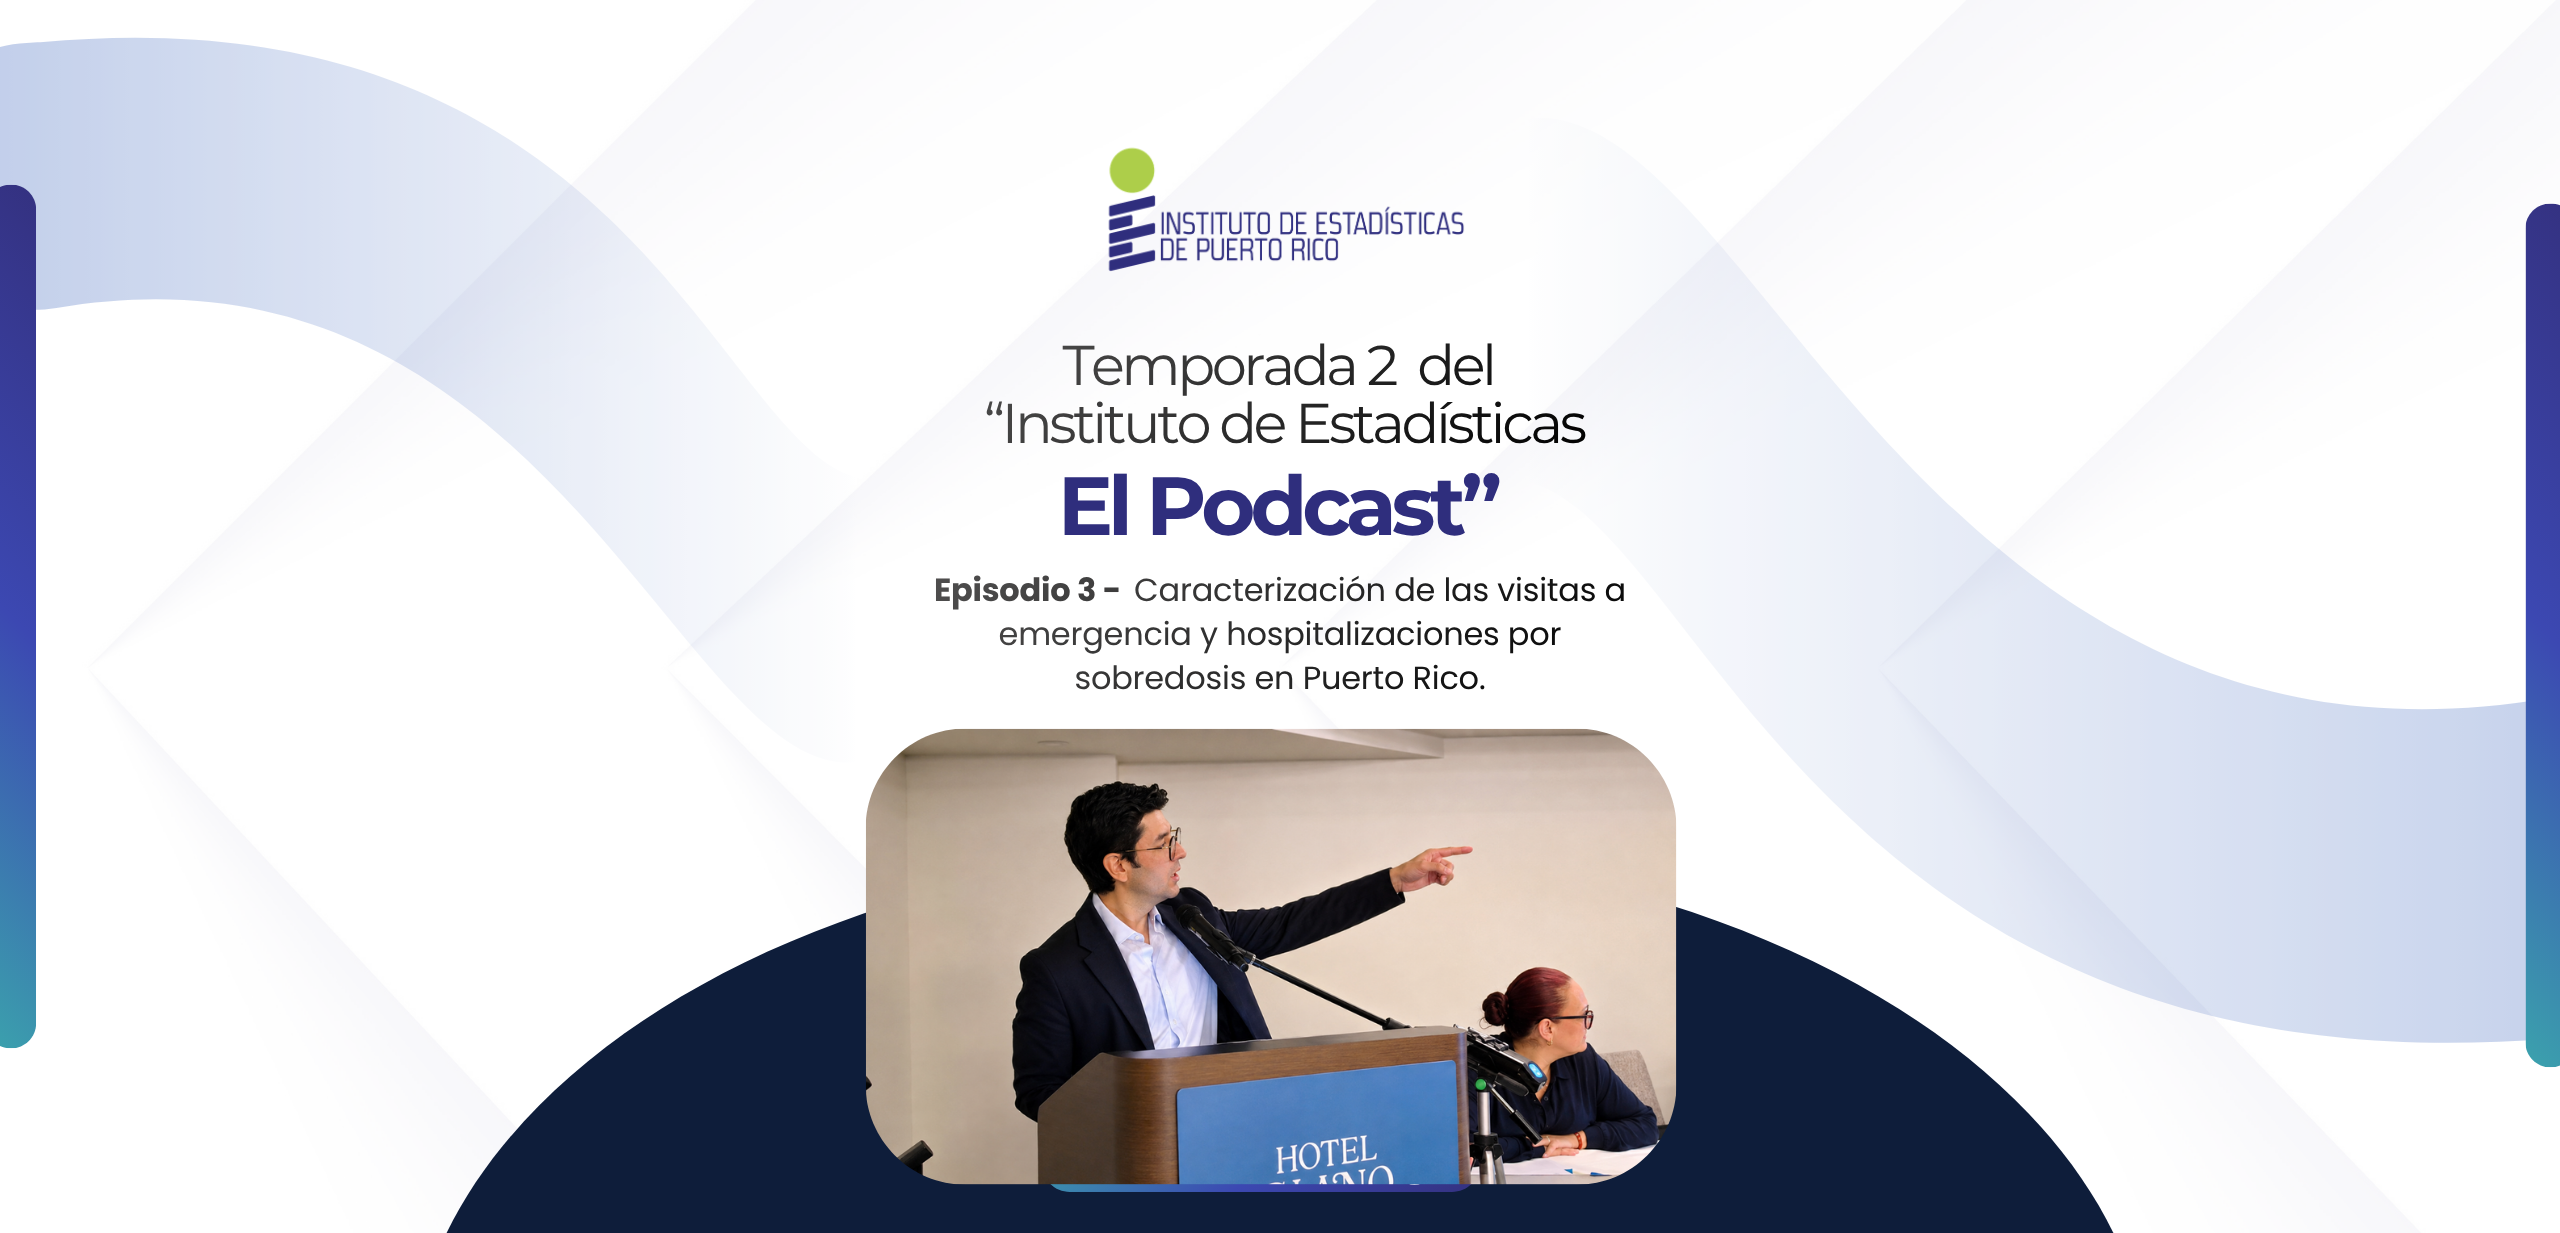
Episode 3 of Season 2 of The Institute of Statistics: The Podcast is now available!
Episode 3 (S2): Characterization of emergency room visits and hospitalizations for overdoses in Puerto Rico.
In this episode, Dr. Eduardo J. Zavala-Mendoza, lead substance abuse researcher for the Puerto Rico Department of Health, takes a deep dive into the characterization of emergency room visits and hospitalizations resulting from potential overdose events, as part of the Collective Action for Violence Prevention in Puerto Rico Symposium.
Access the episode at: https://open.spotify.com/episode/575i8d5T0WMe2raJpAuFub.

.png)
.png)
.png)
.png)