
Fewer people left Puerto Rico

Announcements
IEPR
09 January 2026

Fewer people left Puerto Rico

This is detailed in the most recent Migrant Profile 2021-2022

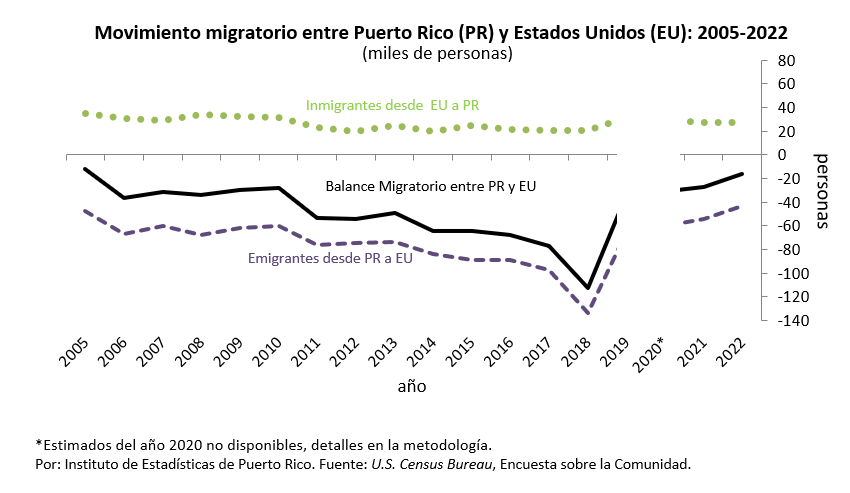
San Juan, PR, December 11, 2023 — During the calendar years 2021 and 2022, data from the Community Survey indicate that the net migration balance between Puerto Rico and the United States decreased from -27 to -16 thousand people emigrating or by -41%. This was revealed by the 2021-2022 Migrant Profile, which was published today by the Puerto Rico Institute of Statistics, and which presents an overview of the migratory movement in Puerto Rico in the calendar year 2021 and 2022. On the other hand, the values continue to reflect more people leaving than entering the jurisdiction in both years. Here are several key findings:

  1. Between 2021 and 2022, Puerto Rico's migration indicators according to the Community Survey showed that:
    • the number of emigrants to the United States was estimated at about 55 thousand and 43 thousand people respectively, resulting in a decrease of -21%. Since 2010, the figure had not been lower than 60,000 emigrants
    • about 27,000 people immigrated to Puerto Rico each year
    • in net terms, the migratory balance between Puerto Rico and the United States decreased from -27 to -16 thousand people emigrating or by -41%.
    • The median age of the emigrant population decreased from 31.9 to 30.3 years, and immigrants were younger than emigrants, showing a reduction in the median age from 39 to 33.8 years.
    • The net migratory balance of the population with some post-secondary education or more decreased from about ten thousand (2021) to four thousand (2022) people emigrating.
  2. DDuring the last twelve years of available information (2010-2019 and 2021-2022), it was estimated, according to the Community Survey, that some 649,000 more people have moved from residence to the United States from Puerto Rico than from the United States to Puerto Rico.
  3. In 2022, passenger flow indicated that:
    • The net movement by plane from Puerto Rico to all destinations (not just the United States) had between seven (-7) thousand and one thousand (-1) passengers according to the U.S. Bureau of Transportation Statistics (BTS) and the Port Authority (AP), respectively.
    • the net movement of passengers by sea (ferry) between Puerto Rico and the Dominican Republic was less than one thousand (724) passengers, according to Caribbean Ferries.
  4. The geographical distribution of emigrants to the United States was:
    • In 2022, as a destination for emigrants, 47% to the Southern region, 25% to the Northeast region and 16% to the Midwest region.
    • the Northeastern region reflected a gradual decrease in emigrants from 47% in 2005 to 25% in 2022.
    • The five states with the highest emigration from Puerto Rico were:
      • in 2021 Florida, Pennsylvania, Texas, Virginia and New Jersey.
      • in 2022 Florida, New York, Pennsylvania, Texas and New Jersey.

“The indicators indicate a reduction in net emigration in recent years. In other words, a decline has been identified in the notorious net migratory flows that prevailed from 2011 to 2019, where net emigration represented between 1.1% and 3.5% of the total annual population of Puerto Rico. Net emigration in 2021 and 2022 represented 0.8% and 0.5% of the total population, respectively. On the other hand, we cannot lose sight of the fact that more people continue to leave than those who enter, which continues to alter the demographic composition of our jurisdiction,” said Alberto L. Velázquez-Estrada, Senior Manager of Statistical Projects at the Institute.

(A graph is included with the series of migration estimates (2005-2022) according to the Community Survey and link to the visualization of the Puerto Rican population in the United States in recent decades as part of the Introduction to the Migrant Profile And to the Maps with the distribution of emigrants by Profile states.)

For more details and information on the full report of the 2021-2022 Migrant Profile, as well as previous publications, you can access the Publications section of the Puerto Rico Institute of Statistics at the link: https://estadisticas.pr/en/publicaciones.
As the lead entity of Puerto Rico's SDC program, the Institute manages the SDC page, which contains the main statistical reports and publications of the U.S. Census Bureau on Puerto Rico, specifically those that are most in demand, such as annual population estimates; the Puerto Rico Community Survey (Puerto Rico Community Survey) and official statistics on Puerto Rico's decennial population and housing censuses, among others.

The Puerto Rico Statistics Institute is an autonomous governmental entity responsible for coordinating the Government's statistical production service to ensure that the data collection and statistics systems, on which public policies are based, are complete, reliable, and have quick and universal access.

For more information you can visit the website: www.estadisticas.pror on social networks through Facebook (@estadisticas .pr), Twitter (@EstadisticasPR) and LinkedIn (Institute of Statistics of Puerto Rico) accounts.

###

Contacts:

Lourdes Burgos, R-27, 787-562-2932

Idia M. Martinez, R-28, 787-603-3200

Share this article:

Please let us know your satisfaction level with our services.

Visit our Official Activities, and participate with us

Visit our Calls for applications and be part of the new opportunities we have for you.

If you have any questions or just want to contact us, visit the Contact Us section.

We are at your disposal. If you need custom statistics, do not hesitate to contact us.

Sign up for our online workshops. Connect with the experts and discover the power of data!

Visit our Blog and keep up to date with the latest news and topics of interest.

Visit our Press Releases and stay connected to the Institute.

Explore the Publication Calendar and keep up to date with Puerto Rico's statistics.

Complete the form for the selection of our Statistics Coordination Committee

Suscribe to receive news directly to your email.

Listen to the Official PRIS podcast and stay informed with the experts

Population reduction continues in 2015

Population reduction continues in 2015

Statistics Institute releases first results on the Study of the Needs of the Deaf Community in Puerto Rico

PRESS RELEASE

Statistics Institute releases first results on the Study of the Needs of the Deaf Community in Puerto Rico

84% of totally deaf people surveyed who needed public safety services and 75% of those who needed services in government agencies faced barriers

July 21, 2022: The executive director of the Puerto Rico Statistics Institute (Institute), Dr. Orville M. Disdier, presented the first results of the Study of the Needs of the Deaf Community in Puerto Rico, through an interactive digital report. This new product, called “Study of the Needs of the Deaf Community: Interactive Report”, presents the first results of the Population Survey that the Institute conducted, both to deaf and partially deaf people, and to the general public. In addition, the interactive report presents the results of focus group interviews with teachers of students with hearing difficulties. The platform presents, for both deaf and partially deaf people, data and statistics on socio-demographic aspects, on the difficulties presented when requesting services, both governmental and non-governmental, on the communication methods used by this community and on the difficulties in accessing information offered by various means of communication, among other findings.

“The data and statistics presented in this interactive report serve as an empirical basis to justify various initiatives and the development of new public policies that promote quality services and better integration of deaf people into the rest of society, while promoting equity and social justice,” said Dr. Disdier.

Some of the most relevant results of the Deaf Community Needs Study:

  • 9% of all respondents indicated that they were completely deaf.
  • 14% of all respondents indicated that they are partially deaf.
  • 62% of the totally deaf people who participated in the survey were deaf at birth, while the remaining 38% became deaf sometime after their birth.
  • 66% of the partially deaf who participated in the survey have a level of severe or profound deafness.
  • 86% of the totally deaf people surveyed said they often feel discriminated against (41% very often and 45% sometimes). On the other hand, 68% of the partially deaf people surveyed said they often feel discriminated against (20% very often and 48% sometimes).
  • 84% of the totally deaf people surveyed, who needed public safety services, faced barriers.
  • 75% of the totally deaf people surveyed, who needed services from government agencies, faced barriers.
  • On the other hand, 53% of the partially deaf people surveyed, who needed services from government agencies, faced barriers.
  • Other places where the totally deaf people surveyed mentioned that they have faced difficulty receiving services, integrating or participating, are:
    • Hospitals (55%)
    • Medical offices (46%)
    • Restaurants (42%)
    • Banks or cooperatives (42%)
    • Place of employment (34%)
    • Cinema or theater (28%)
    • Supermarkets (24%)
    • Concerts or festivals (22%)
    • Gas stations (22%)
  • The communication methods used by the totally deaf people surveyed are:
    • Lip reading (83%)
    • ASL signs (64%)
    • Writing (65%)
    • Verbal (59%)
    • Creole signs (56%)
    • Interpreter (45%)
    • Non-formal signs (26%)
  • On the other hand, the communication methods most used by partially deaf people surveyed are verbal (87%), lip reading (59%) and written (43%).
  • 51% of the totally deaf people surveyed reported using one of the following headphone devices:
    • Behind the ear or behind the ear (64%)
    • CROS hearing aid — BI-CROS (14%)
    • In the ear — Intra shell (11%)
    • Cochlear implant (8%)
    • Open ear — miniature size (3%)
  • 58% of partially deaf people surveyed reported using one of the following headphone devices:
    • Behind the ear or behind the ear (53%)
    • CROS hearing aid — BI-CROS (26%)
    • In the channel — Intracanal (11%)
    • In the ear — Intra shell (5%)
    • Other (6%)
  • 10% of all respondents indicated that they are hearing people (who are not deaf or partially deaf) but who live with a deaf person.
  • 43% of the listeners surveyed, who live with a deaf person, have not taken sign language courses.
  • On the other hand, 42% of all respondents indicated that they are hearing people (who are not deaf or partially deaf) but who know a deaf person.
  • 25% of all respondents indicated that they are hearing people (who are not deaf or partially deaf) who do not live with a deaf person and who do not know a deaf person.
  • In general terms, the educators who participated in the focus groups agreed that there are not many materials adapted for deaf students, so sometimes the teachers themselves have to modify the materials.

In the same way, the educators who participated in the focus groups agreed that in general, parents and/or guardians are not given the necessary support at the time the child is diagnosed. Dr. Disdier explained that the final sample of the survey consisted of 739 adults, 18 years of age or older, living in Puerto Rico, and it was accessible for more than sixty (60) days. A total of 21 educators were part of several focus groups, in which in-depth conversations were held about the needs of deaf students. In this regard, Dr. Disdier argued that “The data collected by educators of deaf students alert us that, like deaf adults, deaf children and adolescents also face challenges and needs, and that these challenges and needs are different and require actions adapted to that demographic sector.”

For his part, Manuel Mangual, Evaluation Specialist, who managed the study, explained that there are still some survey questions that are being processed and whose data will eventually be added to the interactive report. Likewise, in the coming weeks, additional focus group interviews will be conducted, whose results will also be included in the report, expanding and strengthening it. “Working on this project, for the benefit of deaf and partially deaf people, has been a lot of learning, enthusiasm and pride. The study participants gave us the confidence to be part of one voice when it came to their needs. During the next phases, we will continue to produce information aimed at promoting a more inclusive society,” emphasized Mangual.

The Study of the Needs of the Deaf Community: Interactive Report, resides on the website of the Puerto Rico Institute of Statistics and can be accessed at any time by interested parties at the following e-mail address: Outcomes and Needs Deaf Community.

For technical questions about this report, you can send an email to: preguntas@estadisticas.pr.

To learn more about the Institute of Statistics, you can access the website: www.estadisticas.pr.gov. On social media through Facebook accounts (@statistics.pr), Twitter (@EstadisticasPR), Instagram (@institutodeestadisticas) and LinkedIn (Puerto Rico Institute of Statistics).

Institute succeeds in getting UPR Planning School to access data to maintain accreditation

Institute succeeds in getting UPR Planning School to access data to maintain accreditation