Statistics Institute releases data that for the first time make it possible to compare the cost of living in Puerto Rico with 300 other urban and rural areas in the United States
Announcements
IEPR
29 December 2025
Statistics Institute releases data that for the first time make it possible to compare the cost of living in Puerto Rico with 300 other urban and rural areas in the United States
96% of municipalities in Puerto Rico have a population decrease
This is indicated by the estimates for the year 2023 of U.S. Census Bureau
(Approved by the Office of the Electoral Commissioner: OCE-SA-2024-05533)
San Juan, PR, March 18, 2024 — The U.S. Census Bureau released the most recent Annual Population Estimates data for municipalities in Puerto Rico, as well as for counties in the United States. These statistics refer to July 1, 2023 and include estimates of the total population for each municipality and the population change in the current decade. On behalf of the U.S. Census Bureau's Network of Data and Census Information Centers (SDC-PR) in Puerto Rico, the Puerto Rico Statistics Institute (Institute) reported several findings from the new publication of population estimates for 2023:
Compared to the 2020 Decennial Census with a reference date of April 1, 2020, compared to the most recent year available, July 1, 2023, estimates indicate that:
Changes in the population of residents in municipalities ranged from 1.6% to -10.0%.
In 96% of the municipalities, a population decrease was estimated. Meanwhile, in the municipalities of Rincón, Naranjito and Barranquitas, a slight increase (0.1% - 1.6%) was estimated.
Some seven municipalities reflected an estimated reduction equal to or greater than five percent (5%) within the comparative period.
The total population of all of Puerto Rico is estimated to have fallen by 2.4 percent, translating to nearly 80,000 fewer residents than in April 2020.
The seven municipalities with the highest percentage of population decline were Guánica (-10.0%), Loíza (-5.9%), Guayanilla (-5.5%), Ponce (-5.3%), Yauco (-5.2%), Guayama (-5.0%) and Yabucoa (-5.0%).
Five of the seven municipalities are located in southern Puerto Rico, Loíza and Yabucoa in the Northeast and Eastern regions respectively.
The seven municipalities with the lowest percentage of population decline were Aibonito (-0.1%), Isabela (-0.3%), Moca (-0.4%, Dorado (-0.5%), Corozal (-0.6%), Camuy (-0.6%) and Adjuntas (-0.7%).
“The general trend of population decline continues in municipalities, an aspect that began in the jurisdiction for nearly two decades (2005). The phenomenon of reduction is more cautious in several municipalities where the rate is indicated to be five percent or more in just three years of this decade, according to new estimates,” said Alberto L. Velázquez-Estrada, Senior Manager of Statistical Projects at the Institute.
As an interactive summary, the Institute published a visualization that allows us to see the new series of estimates at the municipal level, facilitating geographical comparison within Puerto Rico. This visualization can be accessed at: https://censo.estadisticas.pr/node/517.
As the leading entity of the State DataCenter of Puerto Rico, the Institute manages the SDC portal, which contains the main statistical reports and publications of the U.S. Census Bureau about Puerto Rico, specifically those that are most in demand, such as annual population estimates; the Puerto Rico Community Survey (Puerto Rico Community Survey) and official statistics on Puerto Rico's decennial population and housing censuses, among others. The Puerto Rico SDC portal can be accessed through: censo.estadisticas.pr.
The Puerto Rico Statistics Institute is an autonomous governmental entity responsible for coordinating the Government's statistical production service to ensure that the data collection and statistics systems, on which public policies are based, are complete, reliable, and have quick and universal access.
For more information you can visit the website: www.estadisticas.pr Or write to preguntas@estadisticas.pr. They can also follow social networks through Facebook (@estadisticas .pr), X (@EstadisticasPR), LinkedIn (Institute of Statistics of Puerto Rico) and Instagram (@institutodeestadisticas) accounts.
Statistics Institute releases first results on the Study of the Needs of the Deaf Community in Puerto Rico
84% of totally deaf people surveyed who needed public safety services and 75% of those who needed services in government agencies faced barriers
July 21, 2022: The executive director of the Puerto Rico Statistics Institute (Institute), Dr. Orville M. Disdier, presented the first results of the Study of the Needs of the Deaf Community in Puerto Rico, through an interactive digital report. This new product, called “Study of the Needs of the Deaf Community: Interactive Report”, presents the first results of the Population Survey that the Institute conducted, both to deaf and partially deaf people, and to the general public. In addition, the interactive report presents the results of focus group interviews with teachers of students with hearing difficulties. The platform presents, for both deaf and partially deaf people, data and statistics on socio-demographic aspects, on the difficulties presented when requesting services, both governmental and non-governmental, on the communication methods used by this community and on the difficulties in accessing information offered by various means of communication, among other findings.
“The data and statistics presented in this interactive report serve as an empirical basis to justify various initiatives and the development of new public policies that promote quality services and better integration of deaf people into the rest of society, while promoting equity and social justice,” said Dr. Disdier.
Some of the most relevant results of the Deaf Community Needs Study:
9% of all respondents indicated that they were completely deaf.
14% of all respondents indicated that they are partially deaf.
62% of the totally deaf people who participated in the survey were deaf at birth, while the remaining 38% became deaf sometime after their birth.
66% of the partially deaf who participated in the survey have a level of severe or profound deafness.
86% of the totally deaf people surveyed said they often feel discriminated against (41% very often and 45% sometimes). On the other hand, 68% of the partially deaf people surveyed said they often feel discriminated against (20% very often and 48% sometimes).
84% of the totally deaf people surveyed, who needed public safety services, faced barriers.
75% of the totally deaf people surveyed, who needed services from government agencies, faced barriers.
On the other hand, 53% of the partially deaf people surveyed, who needed services from government agencies, faced barriers.
Other places where the totally deaf people surveyed mentioned that they have faced difficulty receiving services, integrating or participating, are:
Hospitals (55%)
Medical offices (46%)
Restaurants (42%)
Banks or cooperatives (42%)
Place of employment (34%)
Cinema or theater (28%)
Supermarkets (24%)
Concerts or festivals (22%)
Gas stations (22%)
The communication methods used by the totally deaf people surveyed are:
Lip reading (83%)
ASL signs (64%)
Writing (65%)
Verbal (59%)
Creole signs (56%)
Interpreter (45%)
Non-formal signs (26%)
On the other hand, the communication methods most used by partially deaf people surveyed are verbal (87%), lip reading (59%) and written (43%).
51% of the totally deaf people surveyed reported using one of the following headphone devices:
Behind the ear or behind the ear (64%)
CROS hearing aid — BI-CROS (14%)
In the ear — Intra shell (11%)
Cochlear implant (8%)
Open ear — miniature size (3%)
58% of partially deaf people surveyed reported using one of the following headphone devices:
Behind the ear or behind the ear (53%)
CROS hearing aid — BI-CROS (26%)
In the channel — Intracanal (11%)
In the ear — Intra shell (5%)
Other (6%)
10% of all respondents indicated that they are hearing people (who are not deaf or partially deaf) but who live with a deaf person.
43% of the listeners surveyed, who live with a deaf person, have not taken sign language courses.
On the other hand, 42% of all respondents indicated that they are hearing people (who are not deaf or partially deaf) but who know a deaf person.
25% of all respondents indicated that they are hearing people (who are not deaf or partially deaf) who do not live with a deaf person and who do not know a deaf person.
In general terms, the educators who participated in the focus groups agreed that there are not many materials adapted for deaf students, so sometimes the teachers themselves have to modify the materials.
In the same way, the educators who participated in the focus groups agreed that in general, parents and/or guardians are not given the necessary support at the time the child is diagnosed. Dr. Disdier explained that the final sample of the survey consisted of 739 adults, 18 years of age or older, living in Puerto Rico, and it was accessible for more than sixty (60) days. A total of 21 educators were part of several focus groups, in which in-depth conversations were held about the needs of deaf students. In this regard, Dr. Disdier argued that “The data collected by educators of deaf students alert us that, like deaf adults, deaf children and adolescents also face challenges and needs, and that these challenges and needs are different and require actions adapted to that demographic sector.”
For his part, Manuel Mangual, Evaluation Specialist, who managed the study, explained that there are still some survey questions that are being processed and whose data will eventually be added to the interactive report. Likewise, in the coming weeks, additional focus group interviews will be conducted, whose results will also be included in the report, expanding and strengthening it. “Working on this project, for the benefit of deaf and partially deaf people, has been a lot of learning, enthusiasm and pride. The study participants gave us the confidence to be part of one voice when it came to their needs. During the next phases, we will continue to produce information aimed at promoting a more inclusive society,” emphasized Mangual.
The Study of the Needs of the Deaf Community: Interactive Report, resides on the website of the Puerto Rico Institute of Statistics and can be accessed at any time by interested parties at the following e-mail address: Outcomes and Needs Deaf Community.
To learn more about the Institute of Statistics, you can access the website: www.estadisticas.pr.gov. On social media through Facebook accounts (@statistics.pr), Twitter (@EstadisticasPR), Instagram (@institutodeestadisticas) and LinkedIn (Puerto Rico Institute of Statistics).
97,000 PEOPLE IMMIGRATED TO THE UNITED STATES IN 2017
The figure includes only a few of the people who migrated after Hurricane Maria.
San Juan, PR — El U.S. Census Bureau published today the most recent estimates of the Puerto Rico Community Survey known as Puerto Rico Community Survey (PRCS). These statistics refer to information collected during the 2017 calendar year and include social, economic and housing characteristics for Puerto Rico and municipalities with a population of 65,000 people or more. As the leading entity of the Network State Data Center Of U.S. Census Bureau in Puerto Rico, the Puerto Rico Statistics Institute (Institute) presents this brief summary of several findings from this disclosure:
During 2017, 97,000 people moved from Puerto Rico to the United States, while 20,000 people moved in the opposite direction, resulting in a net migratory movement of -77,000 people. Since the PRCS began to be carried out in 2005, this migratory movement, both in absolute and in net terms, represents the highest. These data will be described in greater depth in the Institute's 2017 Migrant Profile, which will be published in the coming months.
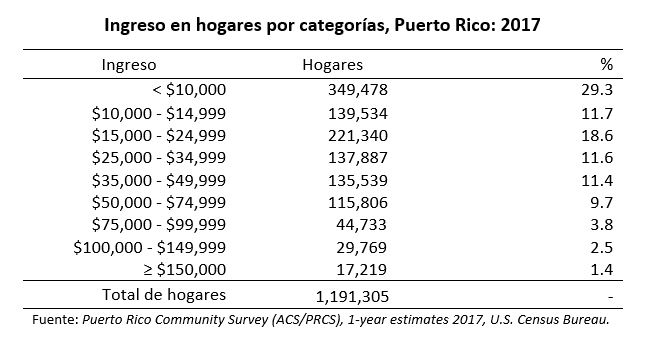
The median household income in Puerto Rico decreased by 3.7% between 2016 ($20,078) and 2017 ($19,343). Household income categories showed that 60% of households had incomes under $25,000. Of these, nearly half (29%) had incomes of less than $10,000.
In 2017, 44% of people and 41% of families were below the poverty level. In families where women are heads of household without a husband present, the percentage was 59%.
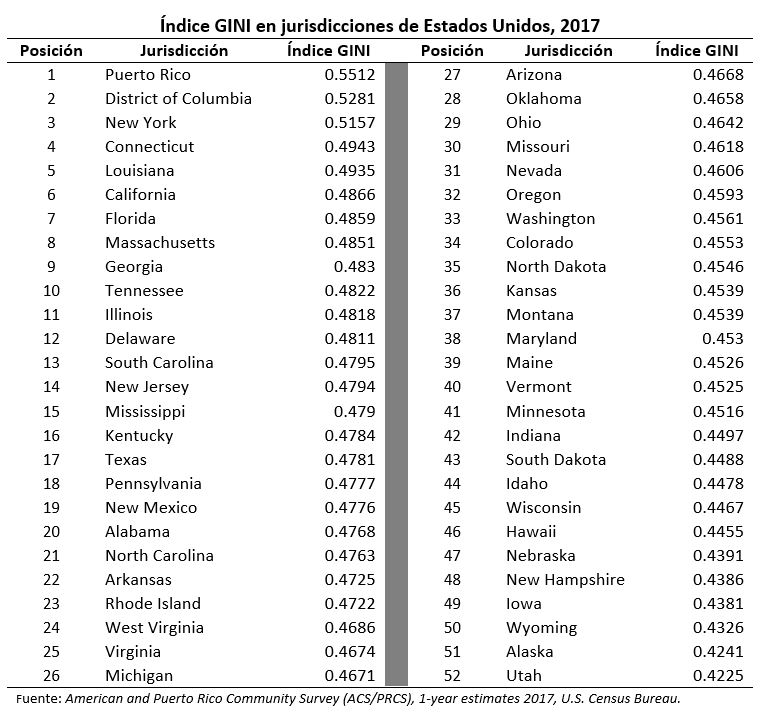
Puerto Rico had a GINI index of 0.55, ranking as the jurisdiction with the highest inequality in income distribution compared to other jurisdictions in the United States. The GINI index measures inequality, where a value of 0 is a perfect distribution of income and a value of 1 is a completely unequal distribution.
“Although again in 2017 emigration broke records in the Community Survey, this was to be expected after the passage of Hurricane Maria. On the other hand, when analyzing these figures, it is important to recognize that the Community Survey is not designed to adequately capture the population displacement that can occur rapidly and volcanically following a natural disaster. As a result, we warned that these numbers only include some of the people who moved in the wake of Hurricane Maria. Many other people who may have moved temporarily or permanently are not captured in this Survey, either because they moved to other foreign countries, relocated to temporary housing where the Survey questionnaire does not arrive, or are even staying in the homes of family members who were living in the United States before 2017, among other possible reasons. In that sense, it will be necessary to wait to see the results of the Survey for 2018 to have a more complete picture of post-Maria migration,” explained Dr. Mario Marazzi-Santiago, executive director of the Institute.
More statistics on the Community Survey estimates can be obtained at: http://factfinder2.census.gov/. If you need assistance using this tool to obtain data, you may find the self-study guide for using this available tool useful: https://censo.estadisticas.pr/fact-finder. Information on the methodology used to produce the estimates can be accessed hither. More details on the characteristics of migrants between Puerto Rico and the United States 2017 will be available at the end of 2018 in the publication of the 2017 Migrant Profile. The Migrant Profile is an annual publication published by the Institute. To view the published Profiles press hither.
In addition, as the leading entity of the Puerto Rico SDC, the IEPR manages the SDC portal, where you can find the main statistical reports and publications of the U.S. Census Bureau on Puerto Rico, specifically those that are most in demand, such as annual population estimates; the Puerto Rico Community Survey (Puerto Rico Community Survey) and official statistics on Puerto Rico's 10-year population and housing censuses, among others. The Puerto Rico SDC portal can be accessed through: https://censo.estadisticas.pr/.
The Puerto Rico Statistics Institute is an autonomous governmental entity responsible for coordinating the Government's statistical production service to ensure that the data collection and statistics systems, on which public policies are based, are complete, reliable, and have quick and universal access. The Institute has in its inventory, accessible through www.estadisticas.pr.gov, over 300 statistical products. In addition, it is a custodian and provides access to over 100 data sets or “data sets” through www.data.pr.gov and to over 40 tables and more than 6 thousand indicators through: www.indicadores.pr.
For more information you can visit our website: www.estadisticas.pr.gov. In addition, you can follow us on social networks through Facebook (estadisticas.pr), Twitter (@EstadisticasPR) and LinkedIn (Institute of Statistics of Puerto Rico) accounts.


-p-130x130q80.png)
.png)
.png)
.png)
.png)
.png)
.png)
.png)
.png)
.png)
.png)
.png)

.png)
.png)
.png)
.png)